Fig. 2
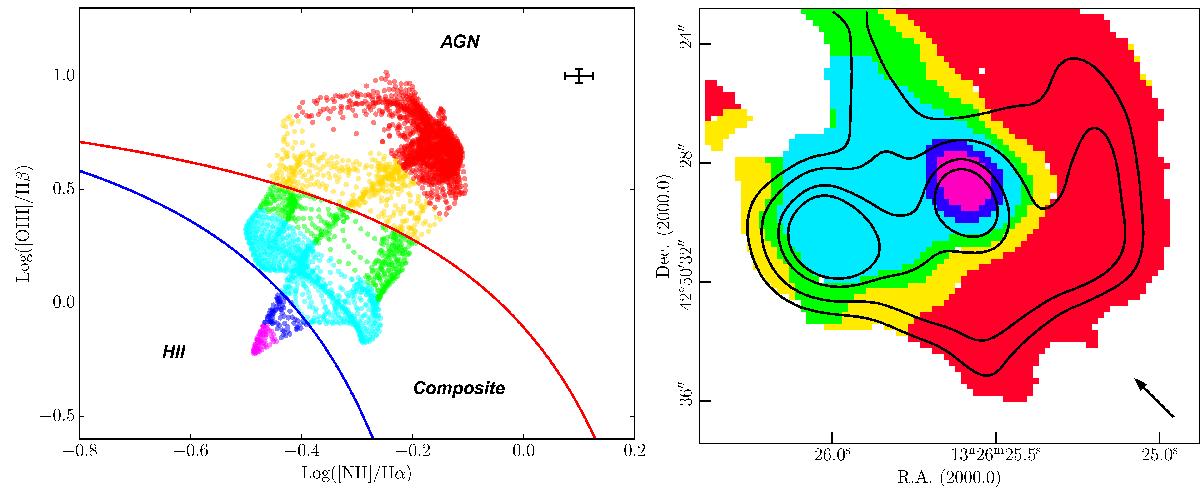
Left panel: [O iii]λ5007/Hβ vs. [N ii]λ6584/Hα diagnostic diagram. The typical error on the line ratios is plotted in the upper right corner. The solid red and blue lines are the lines by Kewley et al. (2001) and Kauffmann et al. (2003) respectively. These lines define the H ii, the composite and the AGN region outlined in the diagram. The points in the diagram are color coded based on the different subset selected for each of the regions. Right panel: pixel map of the region color coded based on the subsets defined in the diagnostic diagram. Hα intensity contours are overplotted in black. Contour levels are 2.98, 1.89, 0.75, 0.33 ×10⁻¹⁶ erg s-1cm-2 arcsec-2. The arrow in bottom-right corner indicates the direction of the radio jet.
Current usage metrics show cumulative count of Article Views (full-text article views including HTML views, PDF and ePub downloads, according to the available data) and Abstracts Views on Vision4Press platform.
Data correspond to usage on the plateform after 2015. The current usage metrics is available 48-96 hours after online publication and is updated daily on week days.
Initial download of the metrics may take a while.