Fig. 1
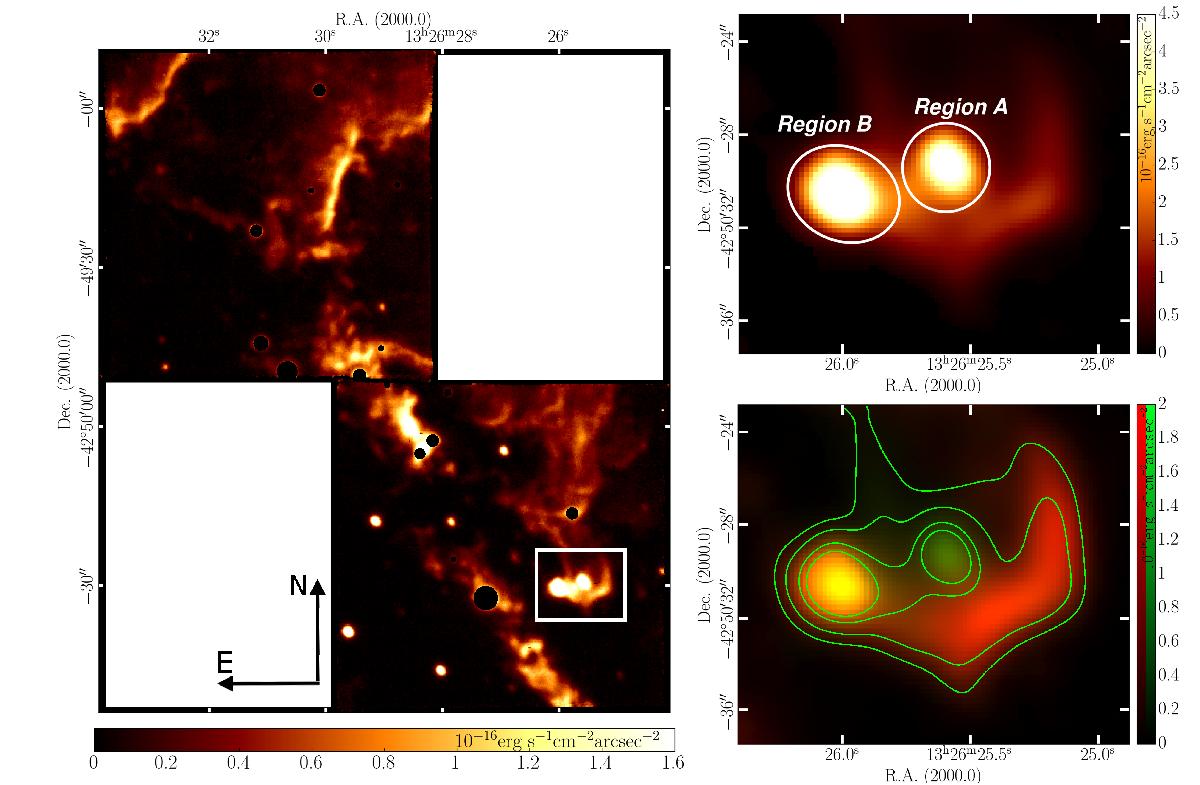
Left panel: total Hα line flux map of the entire MUSE field of view, see Fig. 1 in Santoro et al. (2015b) for additional details. The white rectangle outline the region investigated in the present paper. Top-right panel: total Hα line flux map of the region we study. Regions A and B are outlined in white. Bottom-right panel: color composite image of the [O iii]λ5007 (red) and Hβ (green) emission. The color bar stretching and scale are the same for both images. Hα intensity contours are overplotted in green. Contour levels are 2.98, 1.89, 0.75, 0.33 × 10⁻¹⁶ erg s-1 cm-2 arcsec-2.
Current usage metrics show cumulative count of Article Views (full-text article views including HTML views, PDF and ePub downloads, according to the available data) and Abstracts Views on Vision4Press platform.
Data correspond to usage on the plateform after 2015. The current usage metrics is available 48-96 hours after online publication and is updated daily on week days.
Initial download of the metrics may take a while.