Free Access
Fig. 8
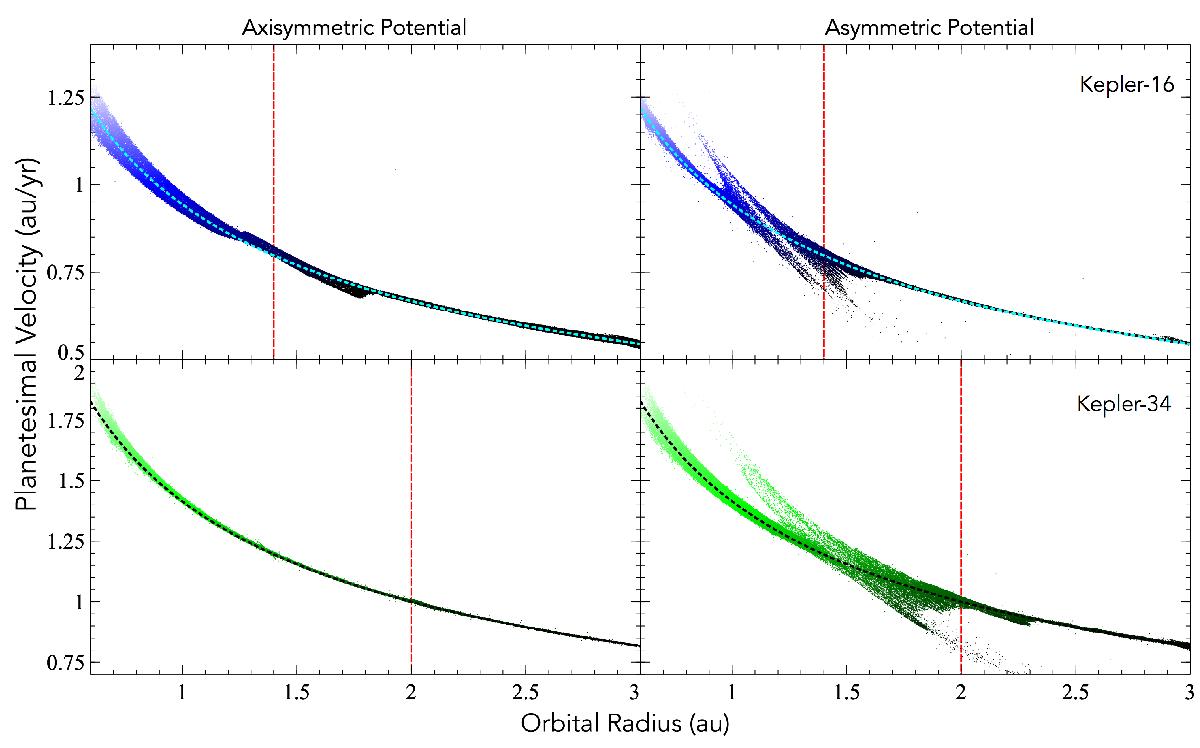
Planetesimal orbital velocity in Kepler-16 (top row) and Kepler-34 (bottom row) for both axisymmetric and asymmetric gas disk gravity inclusion. The Keplerian velocity is shown as a dotted curve and the location of the gas surface density peak at apoapsis (over-density of fluid region) is shown as a red dashed line.
Current usage metrics show cumulative count of Article Views (full-text article views including HTML views, PDF and ePub downloads, according to the available data) and Abstracts Views on Vision4Press platform.
Data correspond to usage on the plateform after 2015. The current usage metrics is available 48-96 hours after online publication and is updated daily on week days.
Initial download of the metrics may take a while.