Free Access
Fig. 2
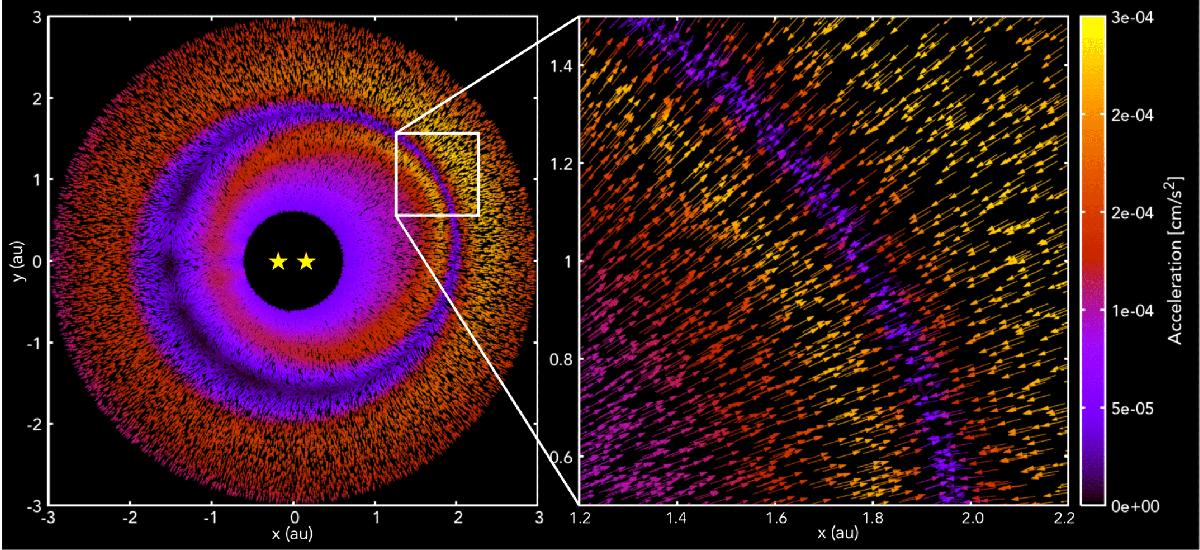
Map of planetesimal accelerations from an N-body test simulation calculated from the gas disk potential of Kepler-34. 50% of planetesimals in the simulation are shown and are plotted as unit vectors with the colour corresponding to their acceleration magnitude.
Current usage metrics show cumulative count of Article Views (full-text article views including HTML views, PDF and ePub downloads, according to the available data) and Abstracts Views on Vision4Press platform.
Data correspond to usage on the plateform after 2015. The current usage metrics is available 48-96 hours after online publication and is updated daily on week days.
Initial download of the metrics may take a while.