Free Access
Fig. 2
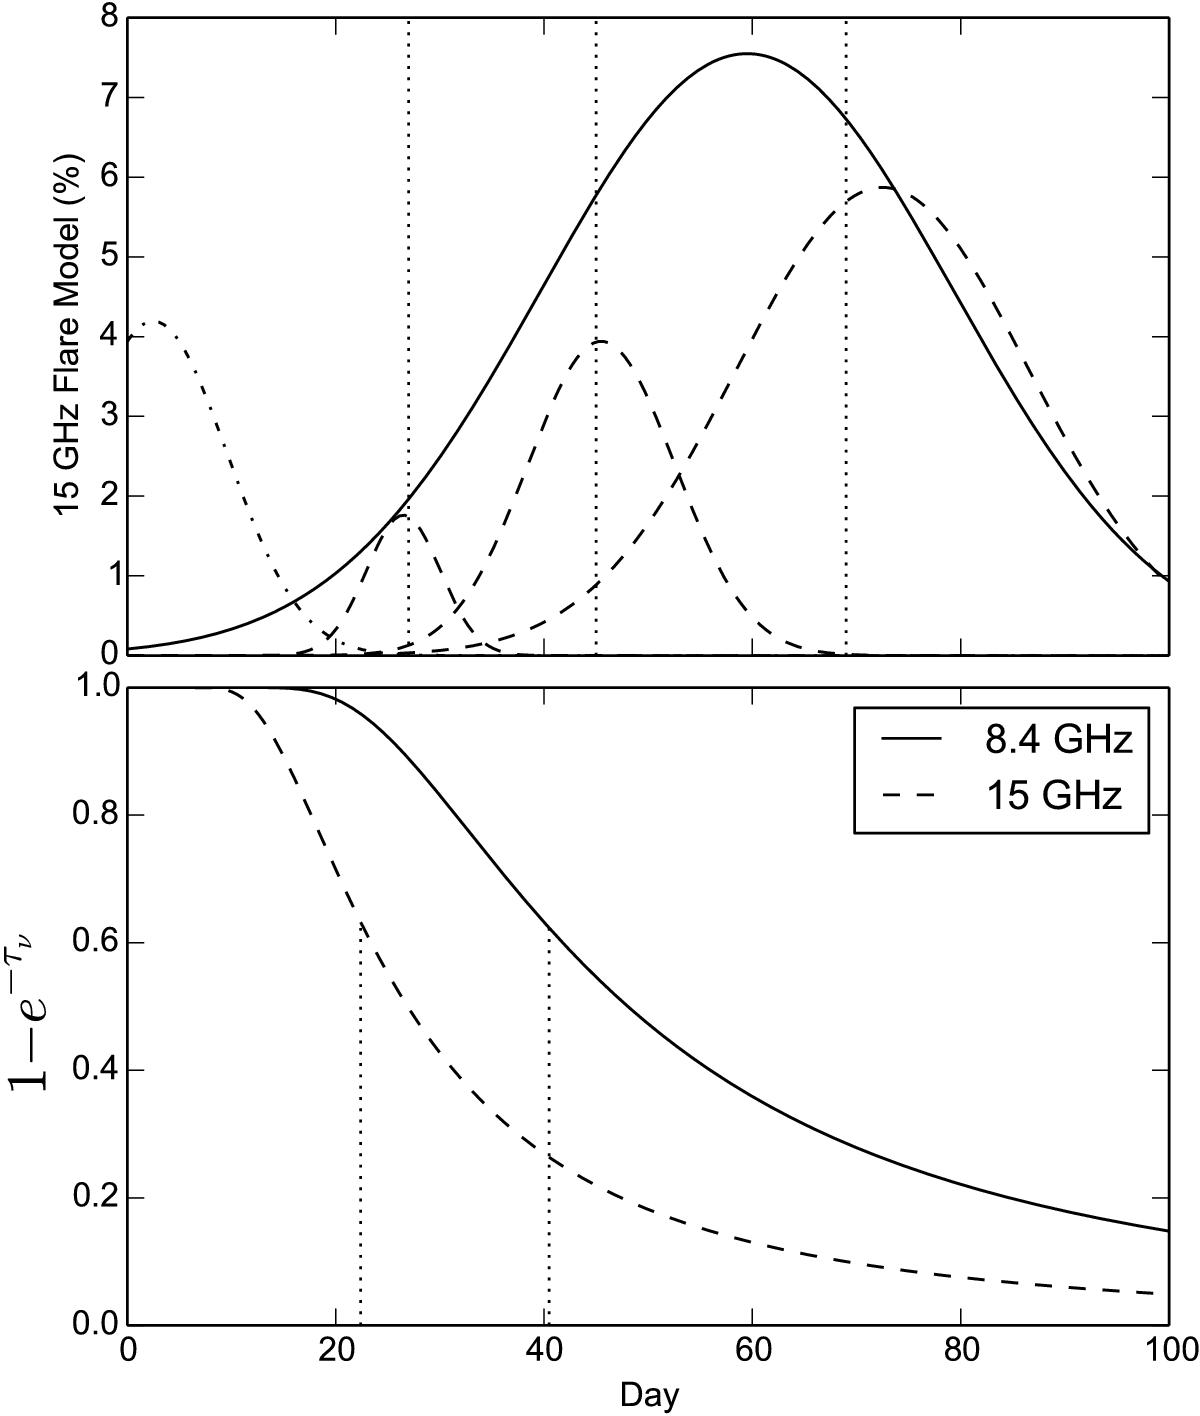
Top panel: Gaussian components used to model the variability in the 15 GHz flux density. The dotted lines mark the locations of the local maxima in the flux-density ratio at 15 GHz. Bottom panel: opacity factor vs. time. The dotted lines mark the epochs where τ ~ 1.
Current usage metrics show cumulative count of Article Views (full-text article views including HTML views, PDF and ePub downloads, according to the available data) and Abstracts Views on Vision4Press platform.
Data correspond to usage on the plateform after 2015. The current usage metrics is available 48-96 hours after online publication and is updated daily on week days.
Initial download of the metrics may take a while.