Free Access
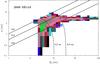
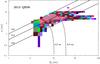
Fig. 3
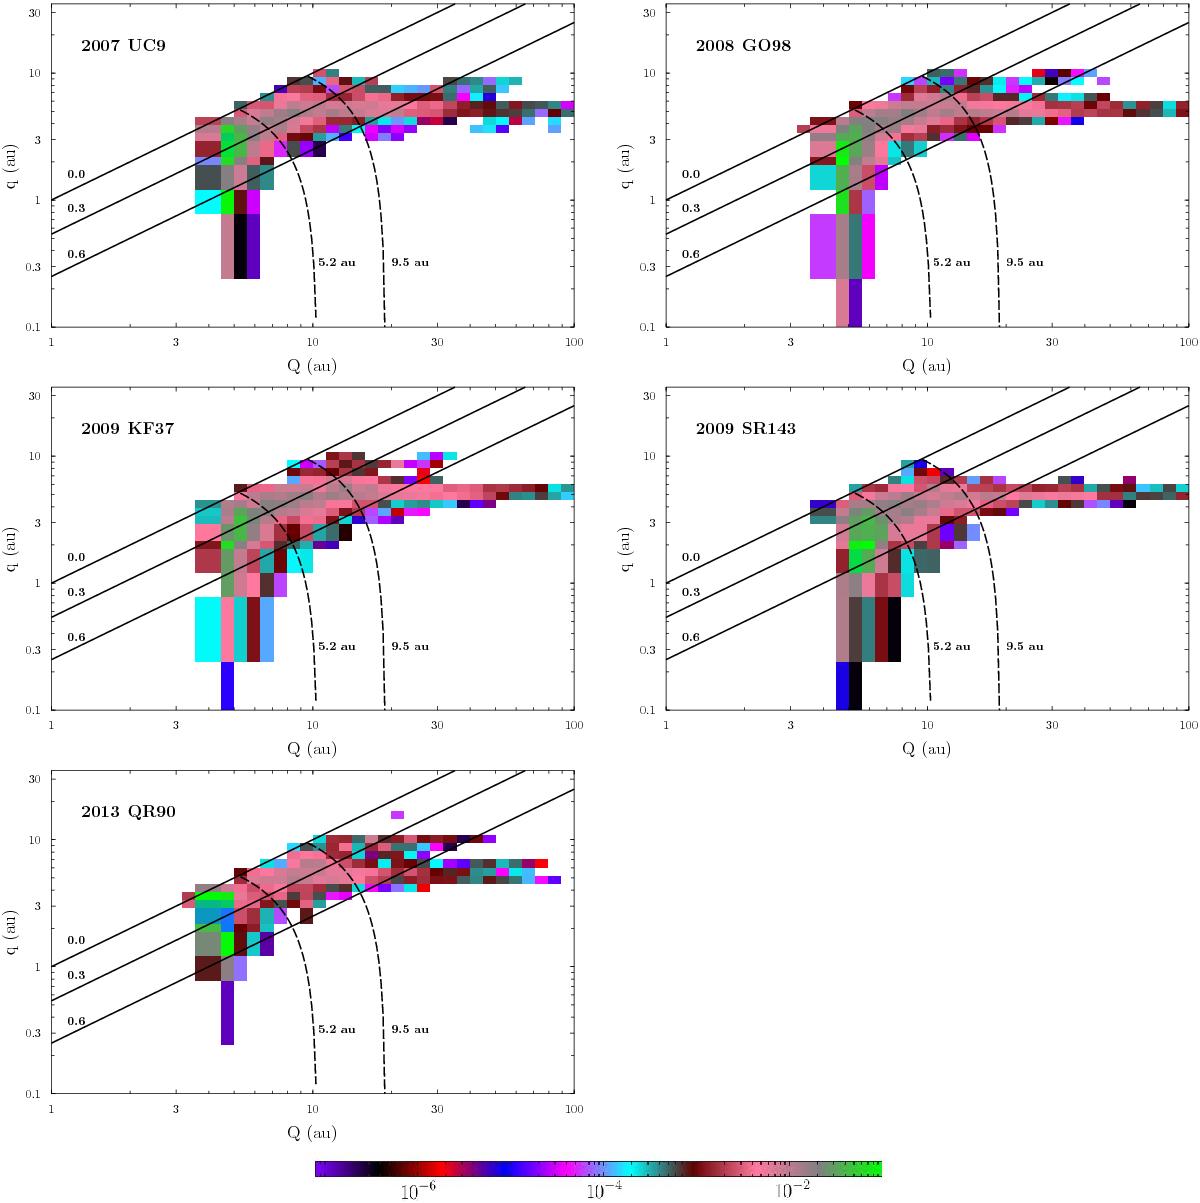
Probability distribution per square au in (Q,q) space for the clones of 2007 UC9, 2008 GO98, 2009 KF37, 2009 SR143, and 2013 QR90. Continuous black lines indicate eccentricities of 0.0, 0.3, and 0.6, and dashed lines indicate semimajor axes of 5.2 and 9.5 au.
This figure is made of several images, please see below:
Current usage metrics show cumulative count of Article Views (full-text article views including HTML views, PDF and ePub downloads, according to the available data) and Abstracts Views on Vision4Press platform.
Data correspond to usage on the plateform after 2015. The current usage metrics is available 48-96 hours after online publication and is updated daily on week days.
Initial download of the metrics may take a while.