Free Access
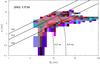
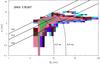
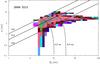
Fig. 2
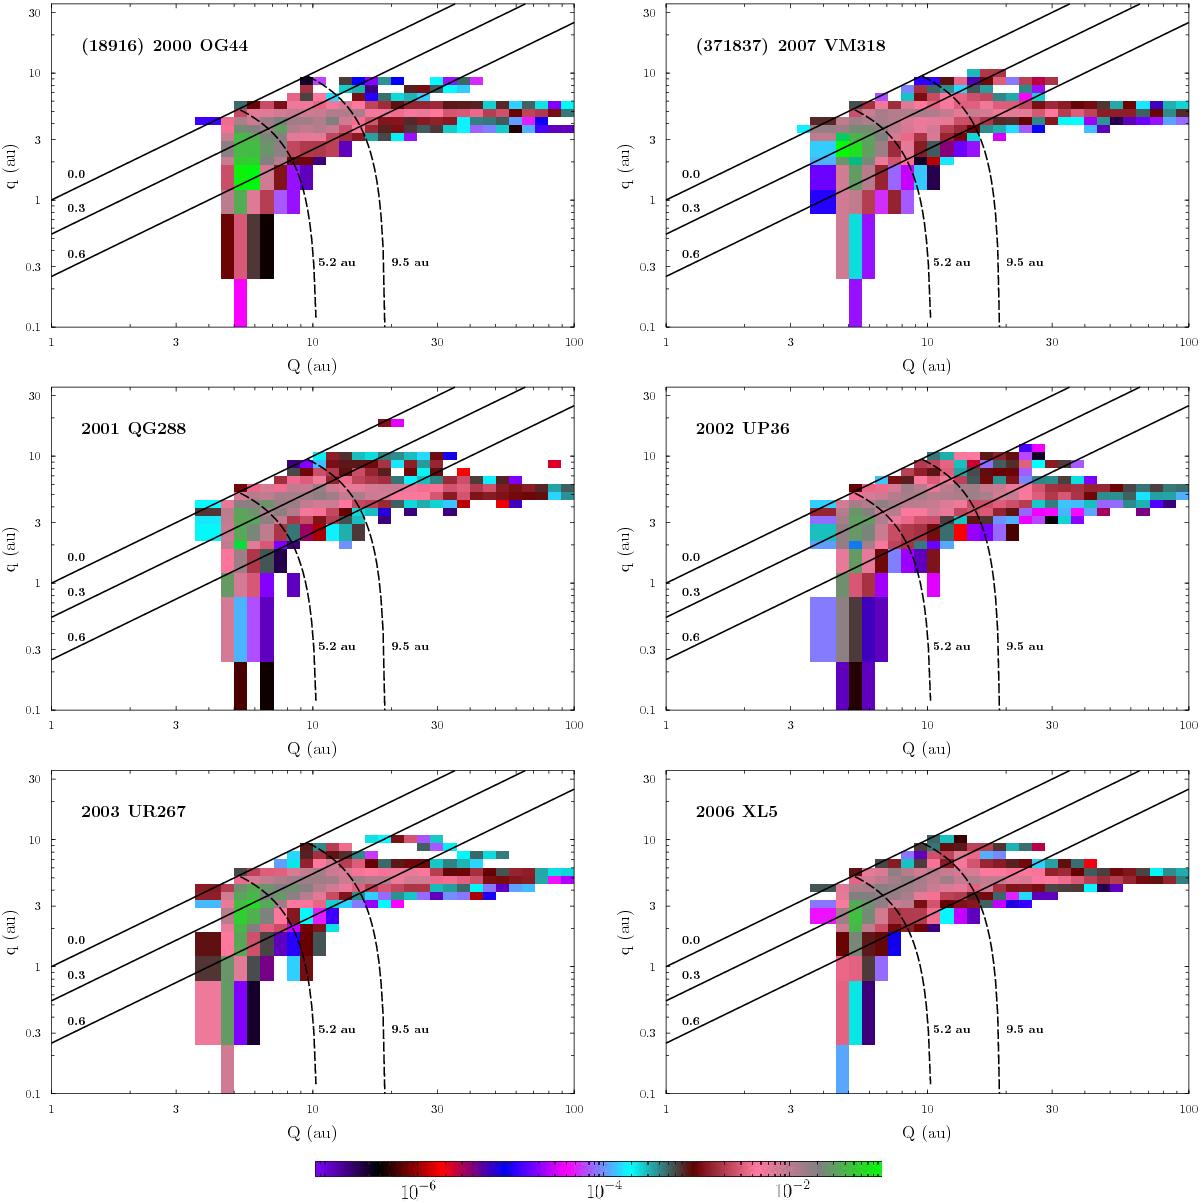
Probability distribution per square au in (Q,q) space for the clones of (18916)2000 OG44, (371837)2007 VM318, 2001 QG288, 2002 UP36, 2003 UR267, and 2006 XL5. Continuous black lines indicate eccentricities of 0.0, 0.3, and 0.6, and dashed lines indicate semimajor axes of 5.2 and 9.5 au.
This figure is made of several images, please see below:
Current usage metrics show cumulative count of Article Views (full-text article views including HTML views, PDF and ePub downloads, according to the available data) and Abstracts Views on Vision4Press platform.
Data correspond to usage on the plateform after 2015. The current usage metrics is available 48-96 hours after online publication and is updated daily on week days.
Initial download of the metrics may take a while.