Fig. 5
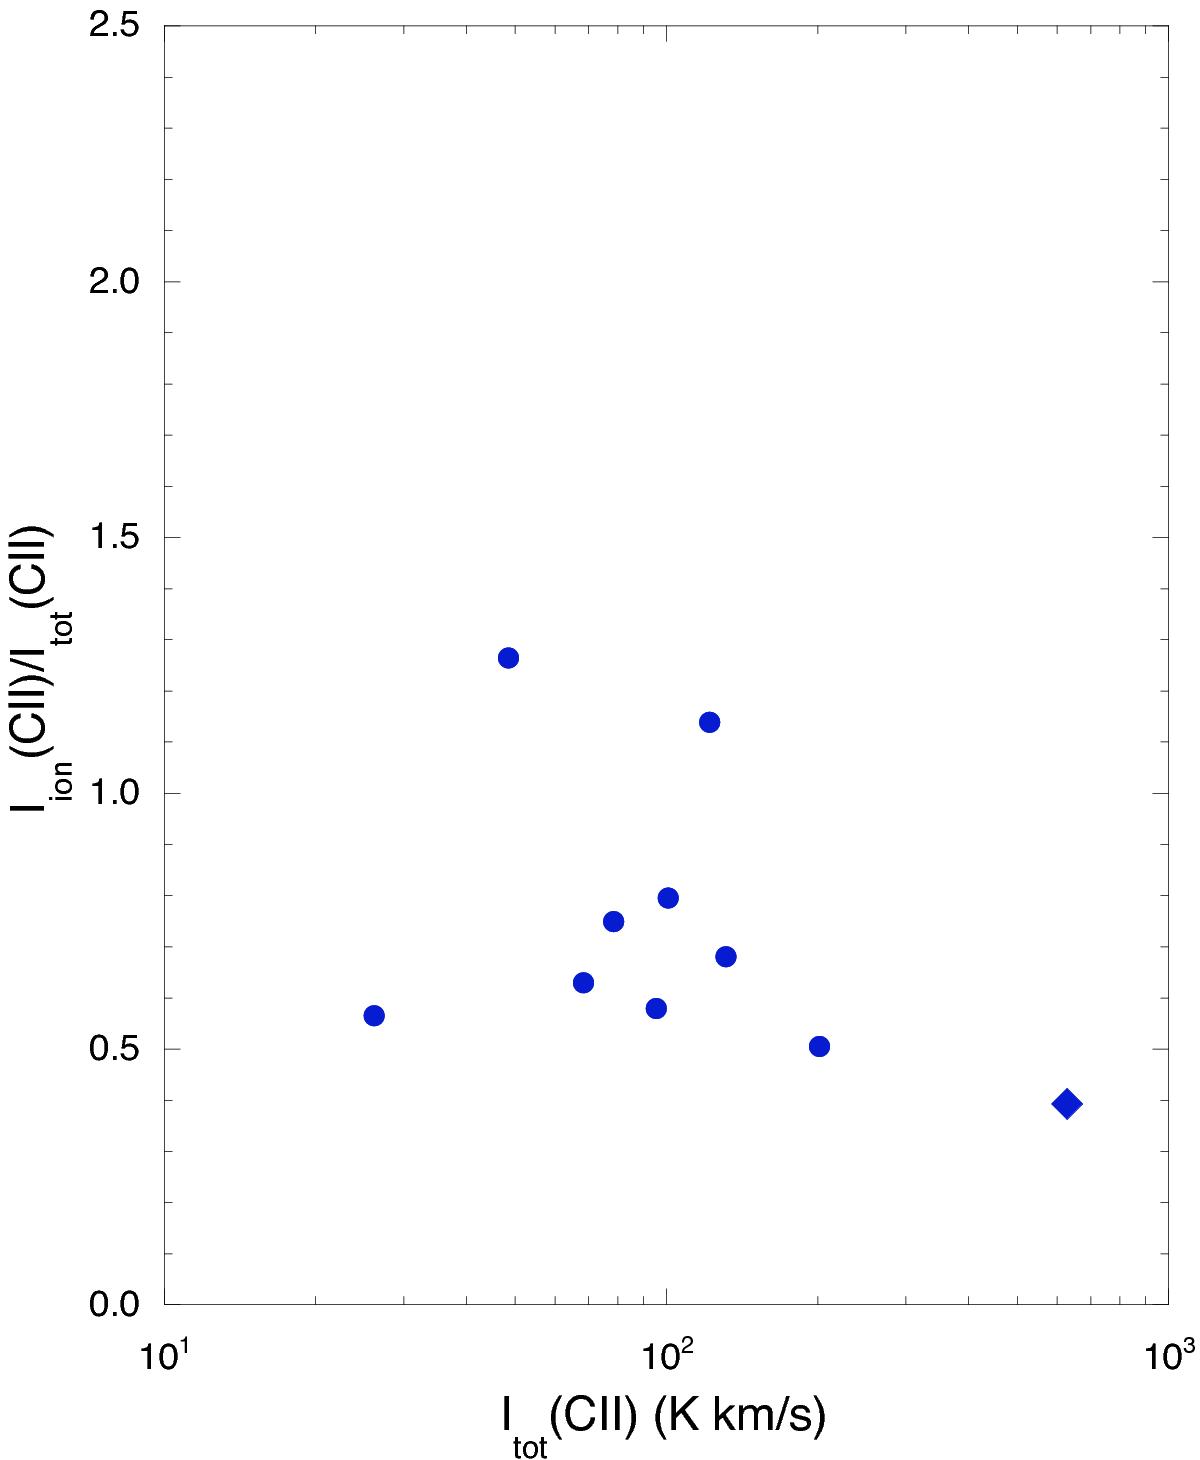
Same as Fig. 4 but calculated for the total emission within the [C ii] and [N ii] bands along each of ten lines of sight as it would be observed by a low resolution spectrometer. The blue filled circles and blue filled diamond are the Galactic disk sources and the Galactic center source, respectively, where Itot([C ii]) equals the observed [C ii] intensity, Iobs([C ii]), uncorrected for foreground absorption. A ratio greater than 1.0 corresponds to a predicted [C ii] arising from the [N ii] region greater than that observed.
Current usage metrics show cumulative count of Article Views (full-text article views including HTML views, PDF and ePub downloads, according to the available data) and Abstracts Views on Vision4Press platform.
Data correspond to usage on the plateform after 2015. The current usage metrics is available 48-96 hours after online publication and is updated daily on week days.
Initial download of the metrics may take a while.