Fig. 1
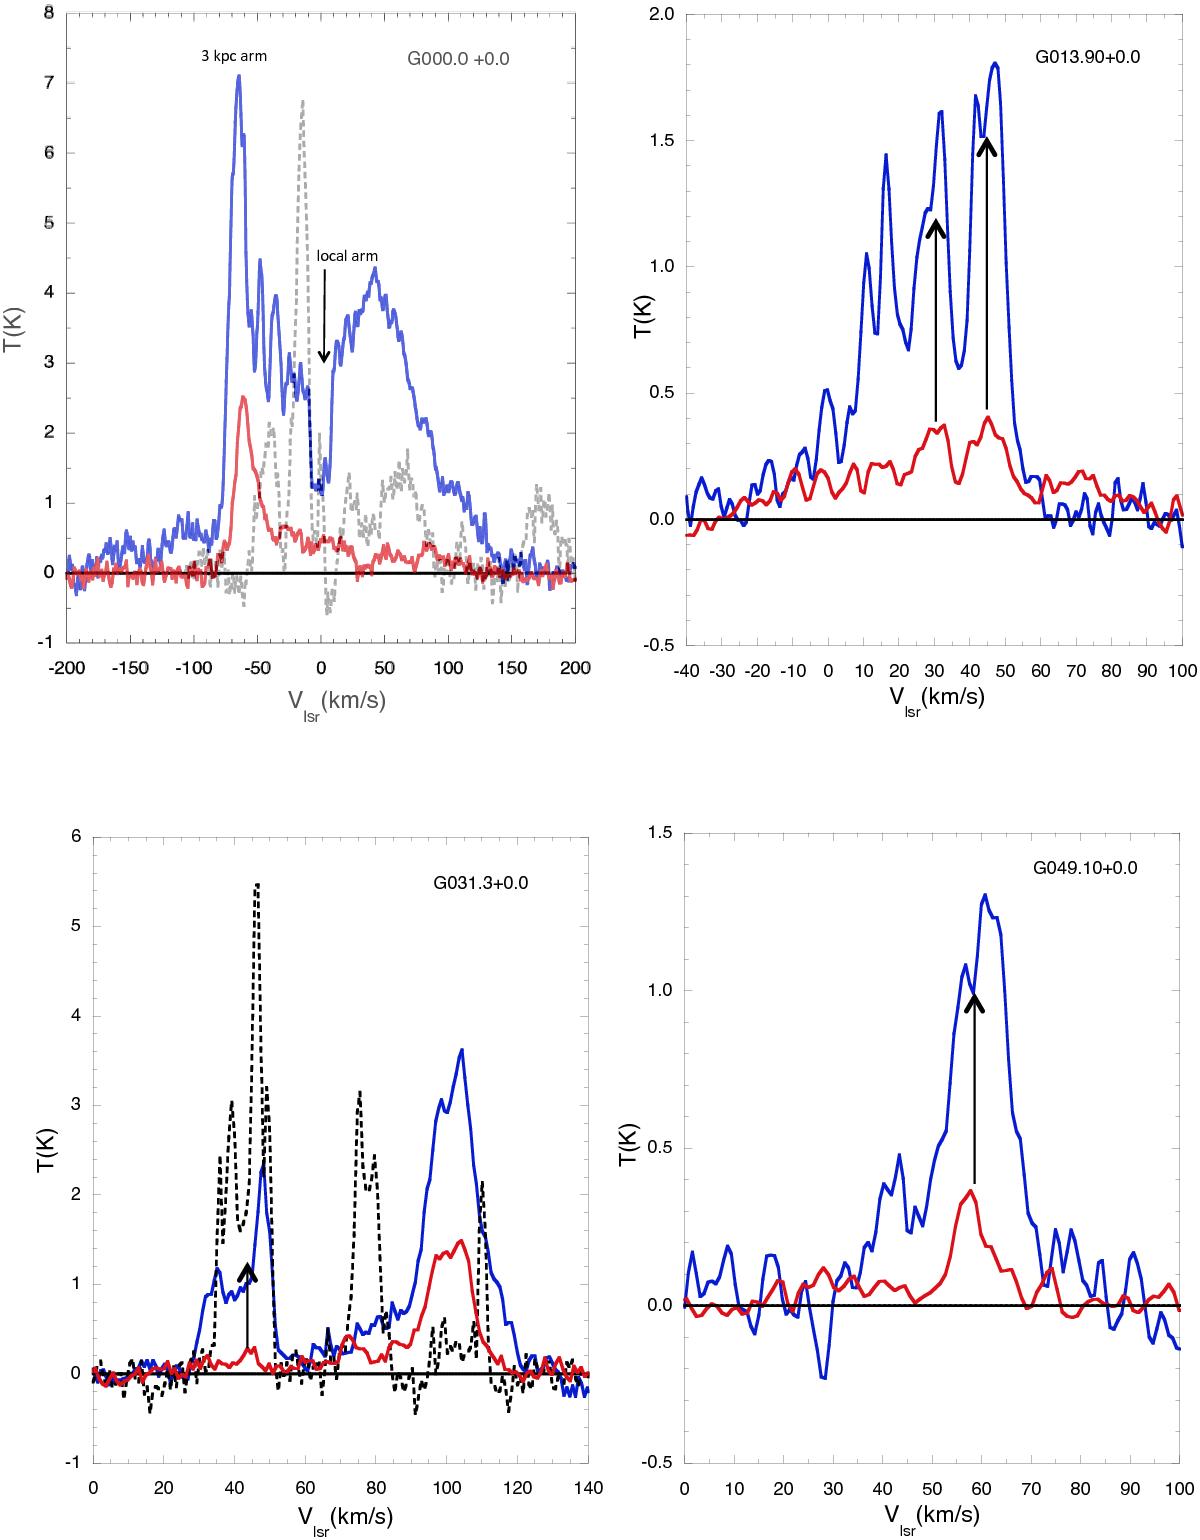
Main beam temperature versus velocity for [C ii] (blue solid spectra) and [N ii] (red solid spectra) taken with HIFI – see Table 1 for some of the line parameters, and 13CO(1−0) (black dashed line) from Pineda et al. (2013). Each LOS is labeled with the GOT C+ LOS label. Some features that are indicative of [C ii] absorption are highlighted with arrows.
Current usage metrics show cumulative count of Article Views (full-text article views including HTML views, PDF and ePub downloads, according to the available data) and Abstracts Views on Vision4Press platform.
Data correspond to usage on the plateform after 2015. The current usage metrics is available 48-96 hours after online publication and is updated daily on week days.
Initial download of the metrics may take a while.