Fig. 6
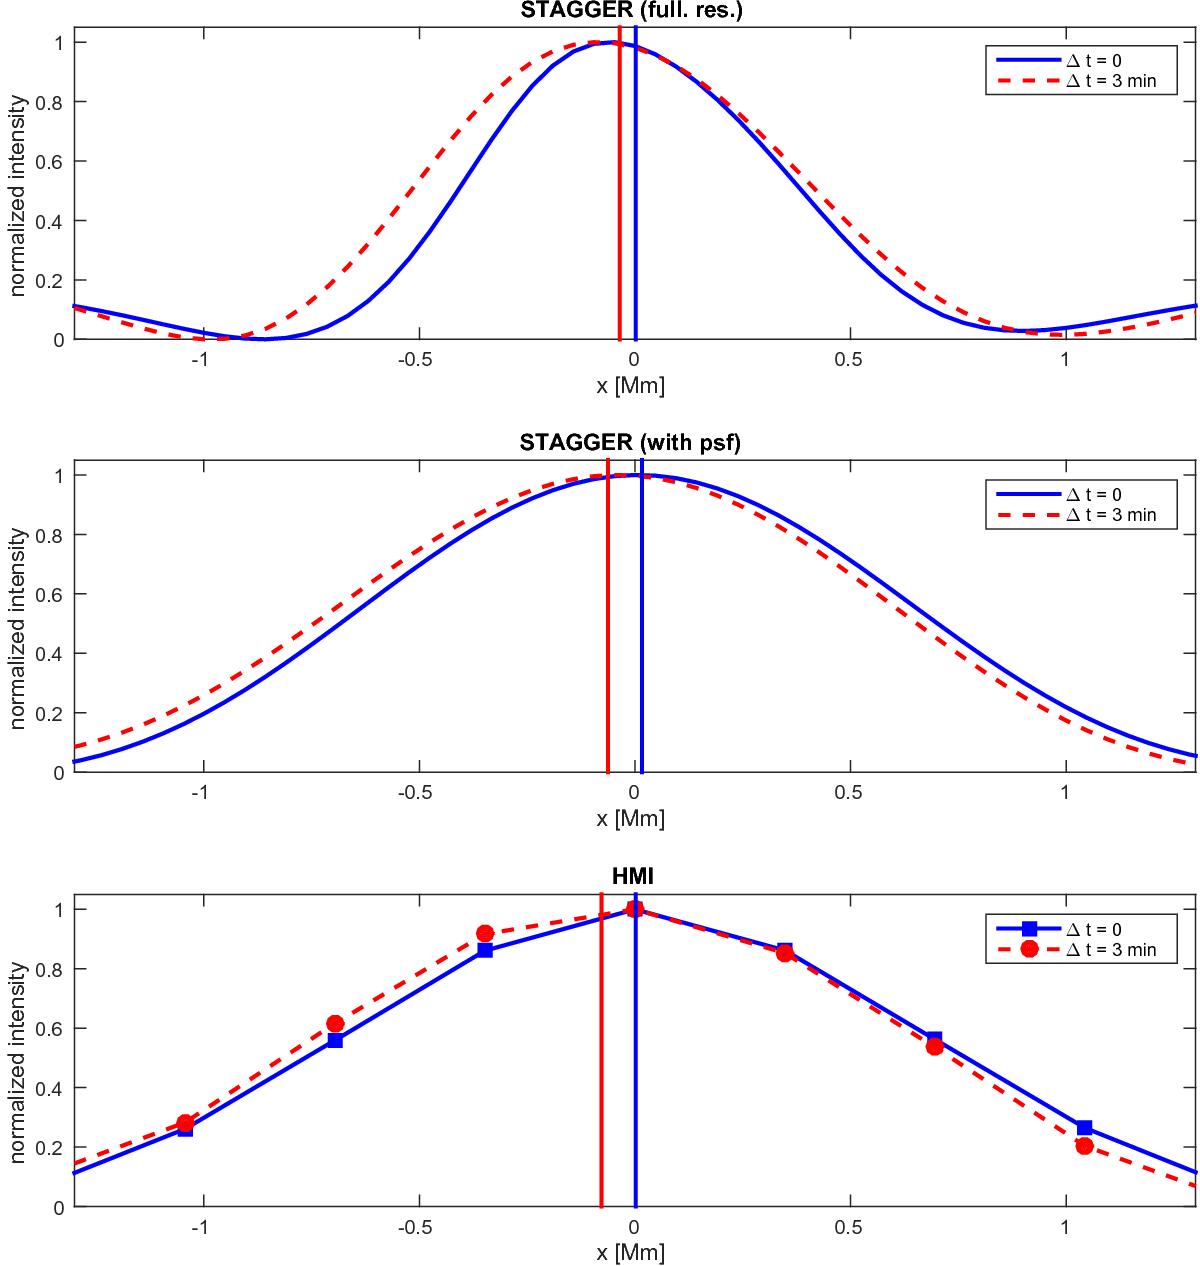
Time evolution of the average granule for a viewing angle of 60° both for synthetic data and HMI data. We identify the positions of the granules in one image (Δt = 0) and then compute the average granule from this image and another one three minutes later, using the same positions of the granules. Top row: STAGGER continuum data with full spatial resolution; middle row: STAGGER data convolved with the PSF from Couvidat et al. (2016); bottom row: HMI continuum data (along the equator). Solid blue line: average granule for Δt = 0 and dashed red line: average granule for Δt = 3 min. The vertical lines show the center of gravity of the average granule for Δt = 0 (black line) and Δt = 3 min (red line). The x-axis points away from disk center. The intensity is normalized to values between 0 and 1 for all granules shown here. The error bars are smaller than the symbol size or the thickness of the lines.
Current usage metrics show cumulative count of Article Views (full-text article views including HTML views, PDF and ePub downloads, according to the available data) and Abstracts Views on Vision4Press platform.
Data correspond to usage on the plateform after 2015. The current usage metrics is available 48-96 hours after online publication and is updated daily on week days.
Initial download of the metrics may take a while.