Fig. 3
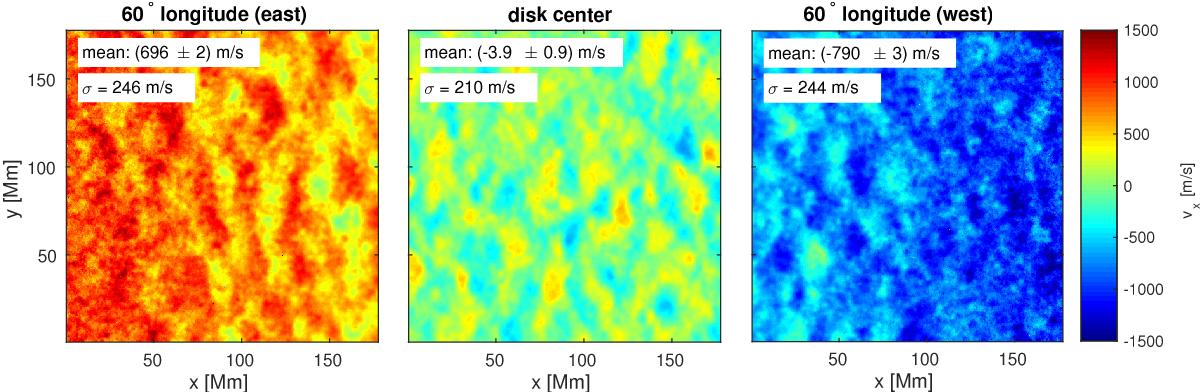
Flow maps derived using LCT from 24 h time-series of HMI continuum intensity images obtained on 7 June 2010 (B0 = 0°) for different longitudes along the equator. Left: 60° east of the central meridian; center: disk center; and right: 60° west of the central meridian. We show the velocity directed in the east-west direction (vx, pointing westward). The numbers in each panel give the mean and the standard deviation of the velocities. All datasets clearly show supergranulation, however, when observing away from disk center, an apparent large-scale flow is superimposed on the flow maps, reaching up to one km s-1. This is the shrinking-Sun effect.
Current usage metrics show cumulative count of Article Views (full-text article views including HTML views, PDF and ePub downloads, according to the available data) and Abstracts Views on Vision4Press platform.
Data correspond to usage on the plateform after 2015. The current usage metrics is available 48-96 hours after online publication and is updated daily on week days.
Initial download of the metrics may take a while.