Fig. 2
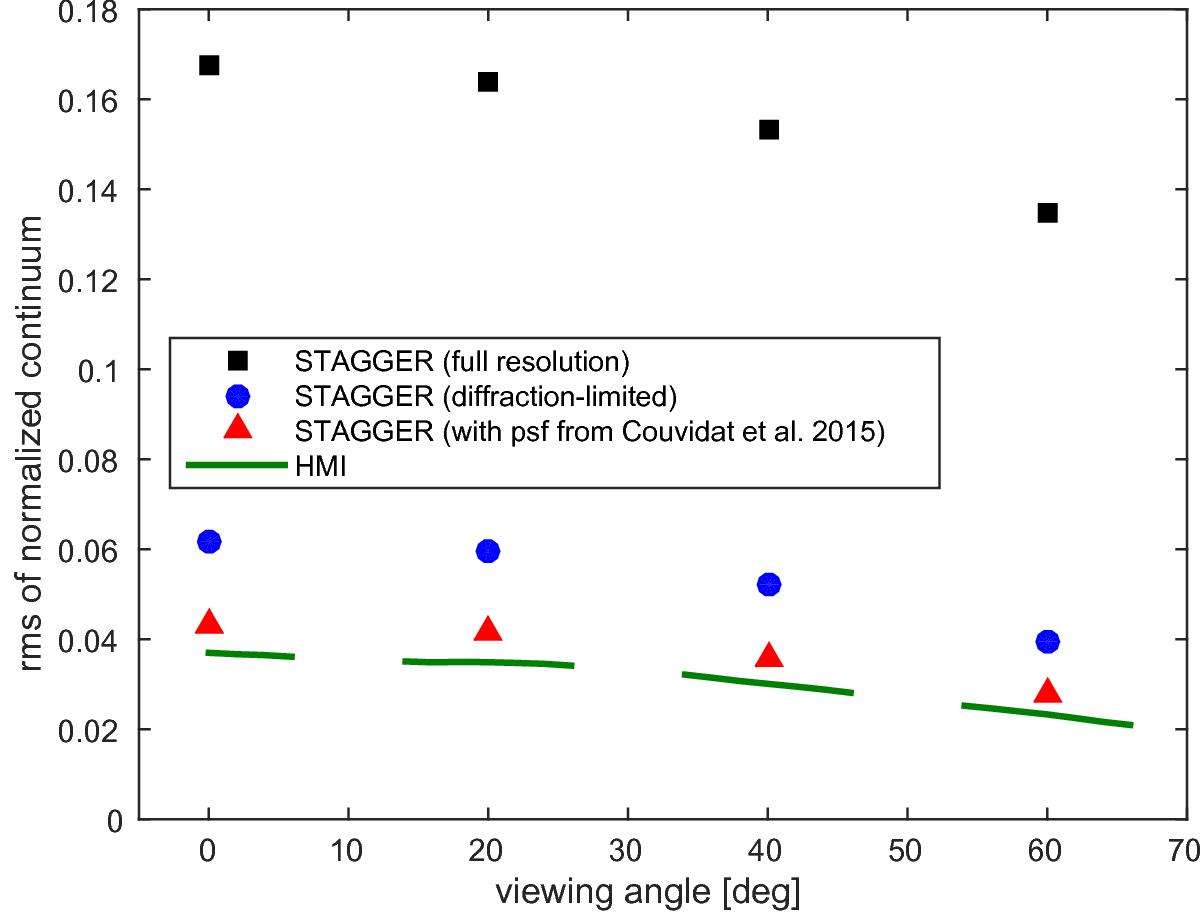
Root mean square of the normalized continuum intensity as a function of the viewing angle. We show results for four different datasets. Black squares: continuum intensity maps derived from the STAGGER simulations (full spatial resolution); blue circles: synthetic data corresponding to a diffraction-limited instrument; red triangles: STAGGER data convolved with the PSF from Couvidat et al. (2016) with γ = 2.5; and green line: HMI data (along the equator, west of the central meridian). The error bars are smaller than the symbol size or the thickness of the line.
Current usage metrics show cumulative count of Article Views (full-text article views including HTML views, PDF and ePub downloads, according to the available data) and Abstracts Views on Vision4Press platform.
Data correspond to usage on the plateform after 2015. The current usage metrics is available 48-96 hours after online publication and is updated daily on week days.
Initial download of the metrics may take a while.