Fig. 9
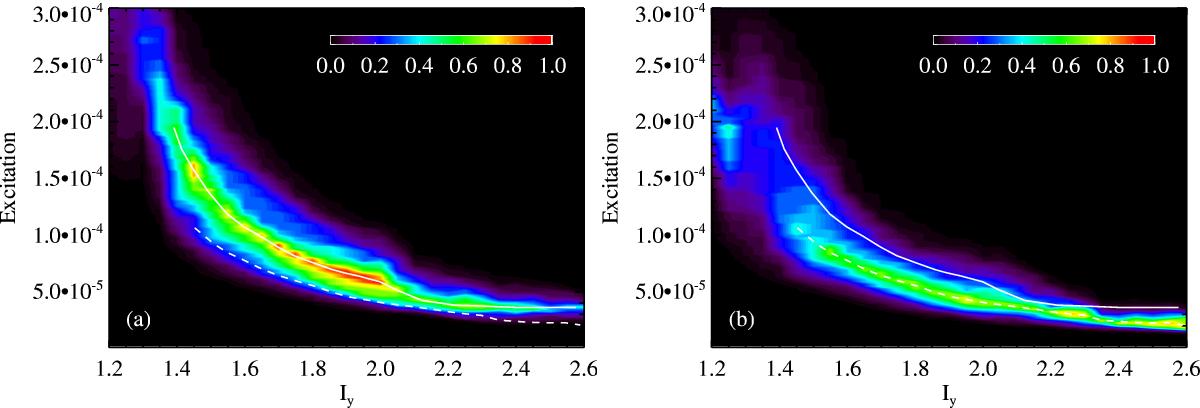
a) K-S probability as a function of Iy and El when the theoretical spin axis RA distribution is compared to the observationally derived one for case 1. b) The same as a), but in this case the theoretical and observationally derived Dec distributions are compared. In the two figures, the continuous white line, El,RA = El [ Iy ], indicates the excitation level for each Iy associated with the highest K-S probability when RA distributions are compared. The dashed white line, El,Dec = El [ Iy ], represents the excitation level for each Iy associated with the highest K-S probability when the Dec distributions are compared.
Current usage metrics show cumulative count of Article Views (full-text article views including HTML views, PDF and ePub downloads, according to the available data) and Abstracts Views on Vision4Press platform.
Data correspond to usage on the plateform after 2015. The current usage metrics is available 48-96 hours after online publication and is updated daily on week days.
Initial download of the metrics may take a while.