Fig. 7
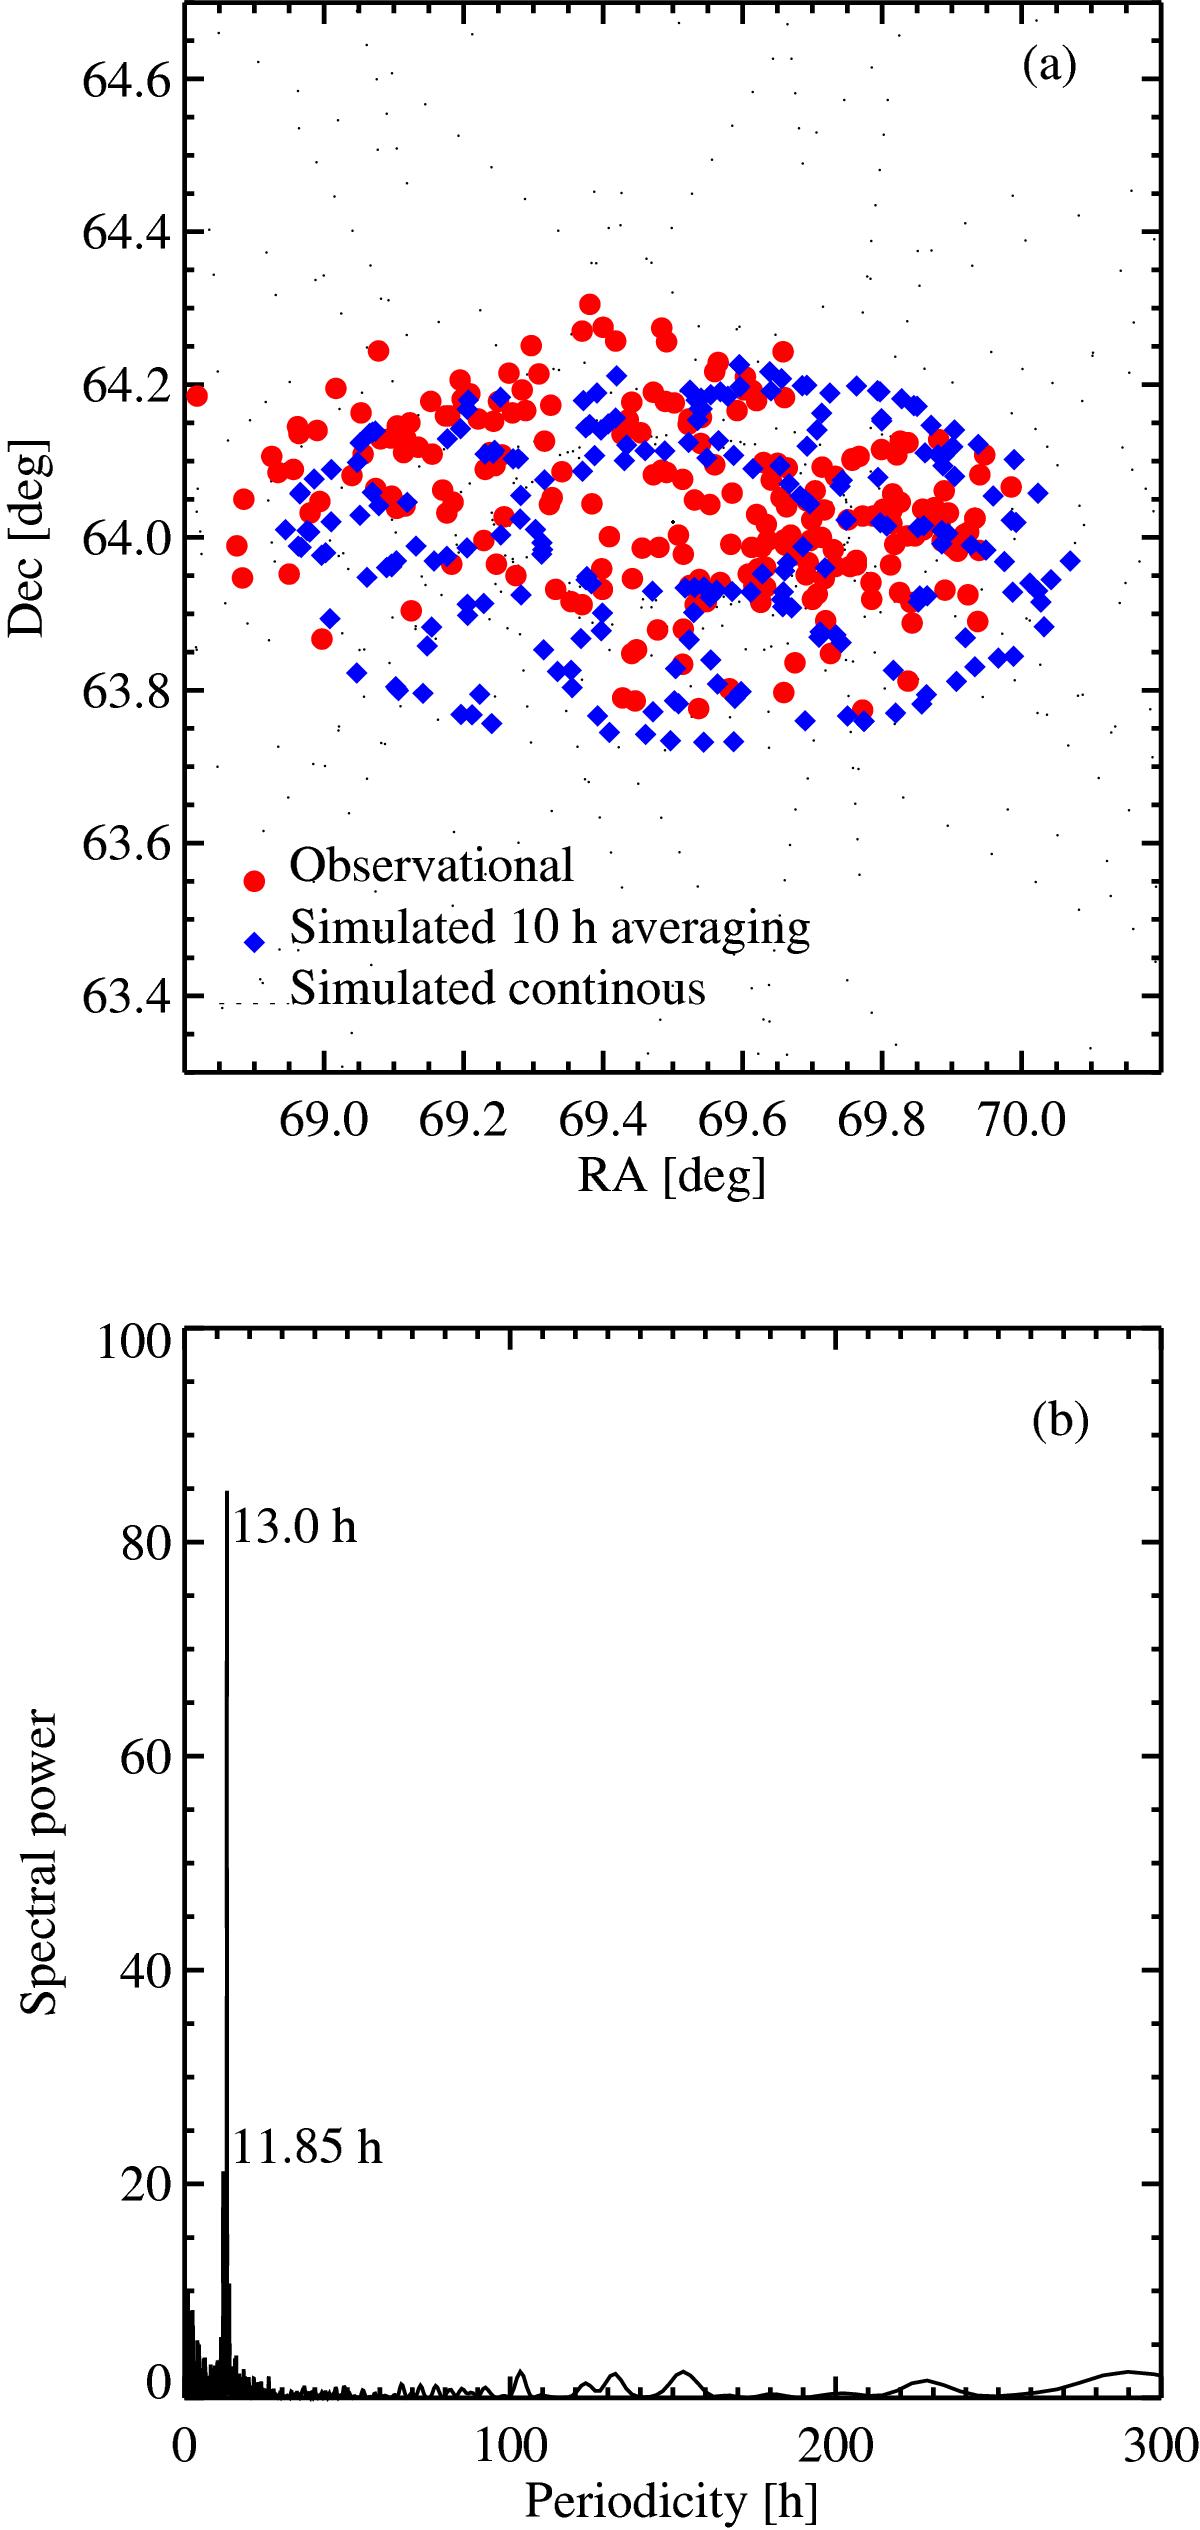
a) As previously, bullets (•) show the observationally derived spin axis (Fig. 2). Small dots (·) are the spin axis orientation for a simulated body with inertia moments 1:1.90:1.905 and an El = 2.9 × 10⁻⁶ (see text). The data are displayed with a time separation of 1 h. As previously, diamonds (◆), to be compared with the bullets distribution, correspond to the averaging within 10 h of the instantaneous theoretical values. b) Lomb periodogram of the Dec-simulated data (diamonds) shown in Fig. 7a. The x-axis here ranges up to 300 h to show that no significant periodicity is detected beyond Pc = 13 h. Given the wide range covered by the x-axis, the two significant periodicities Pφ = 11.85 h and Pc appear very close in the figure.
Current usage metrics show cumulative count of Article Views (full-text article views including HTML views, PDF and ePub downloads, according to the available data) and Abstracts Views on Vision4Press platform.
Data correspond to usage on the plateform after 2015. The current usage metrics is available 48-96 hours after online publication and is updated daily on week days.
Initial download of the metrics may take a while.