Fig. 5
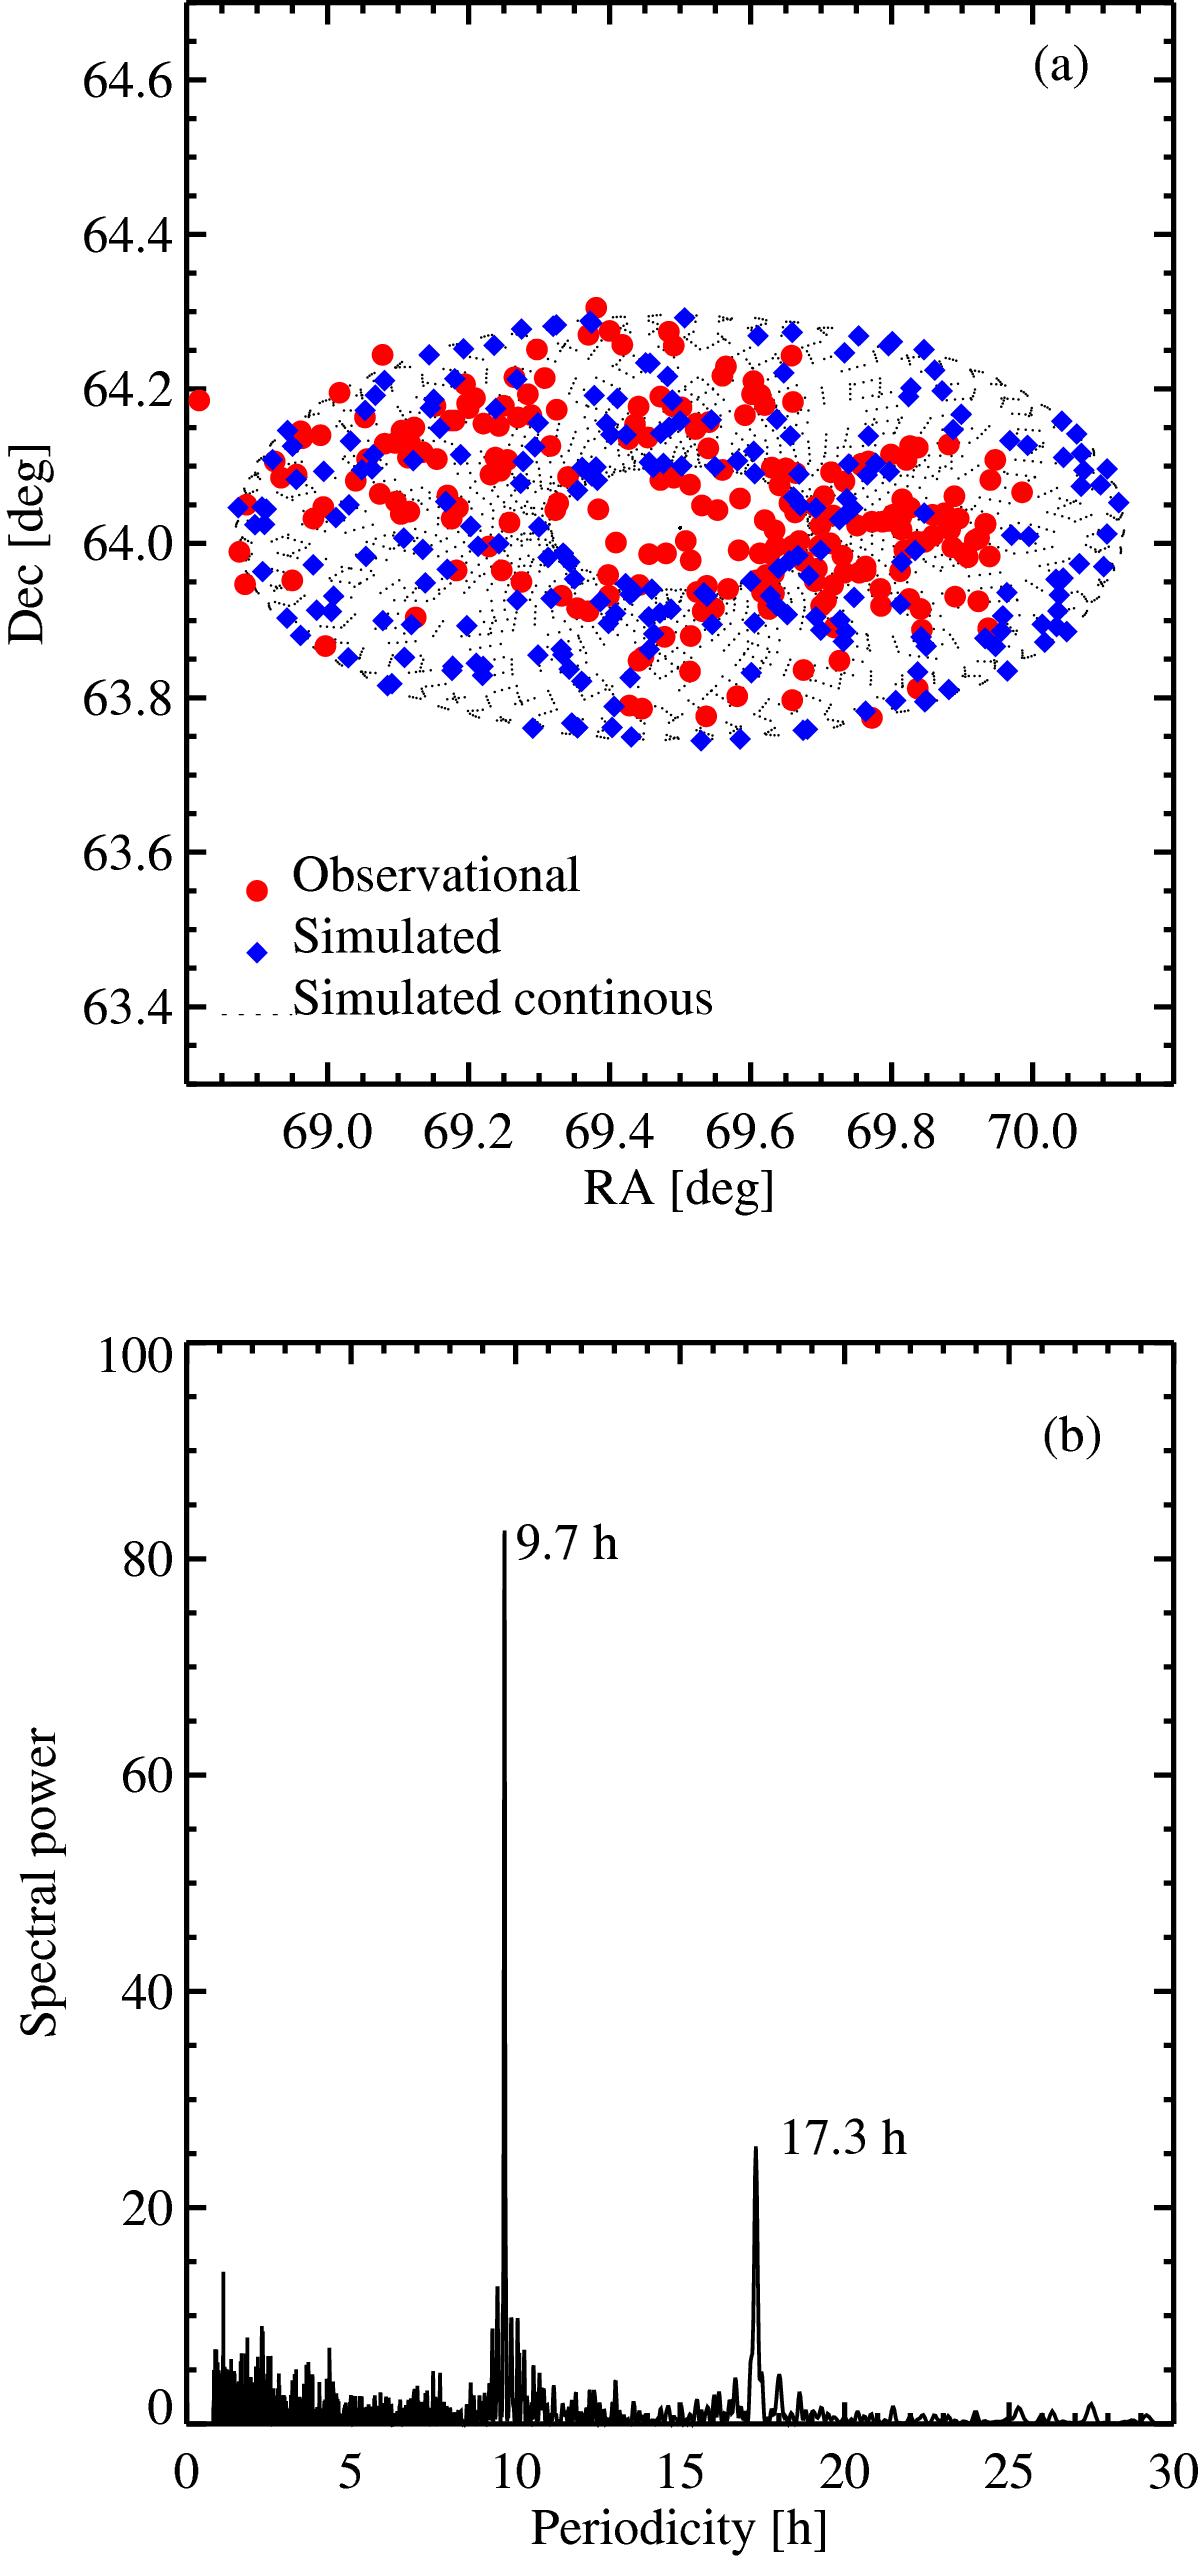
a) Bullets (•) show the spin axis orientation as determined with the SPC method (Fig. 2). Small dots (·) are the spin vector orientation for a simulated body with inertia moments equal to those derived from the shape of 67P assuming homogeneity, and an El = 1.9 × 10⁻⁶ under case 1 circumstances. These data are displayed with a time separation of 1 h. Diamonds (◆), to be compared with the bullet distribution, correspond to the orientation of the spin axis for the simulation performed at the time and date associated with each determination made with the SPC method. To locate the diamonds, neither noise nor averaging have been included. b) Lomb periodogram of the Dec-simulated coordinates (diamonds) shown in Fig. 5a. The RA coordinate periodogram is exactly the same as that of the Dec data, only small differences in spectral power (height of the peak) can be appreciated.
Current usage metrics show cumulative count of Article Views (full-text article views including HTML views, PDF and ePub downloads, according to the available data) and Abstracts Views on Vision4Press platform.
Data correspond to usage on the plateform after 2015. The current usage metrics is available 48-96 hours after online publication and is updated daily on week days.
Initial download of the metrics may take a while.