Fig. 10
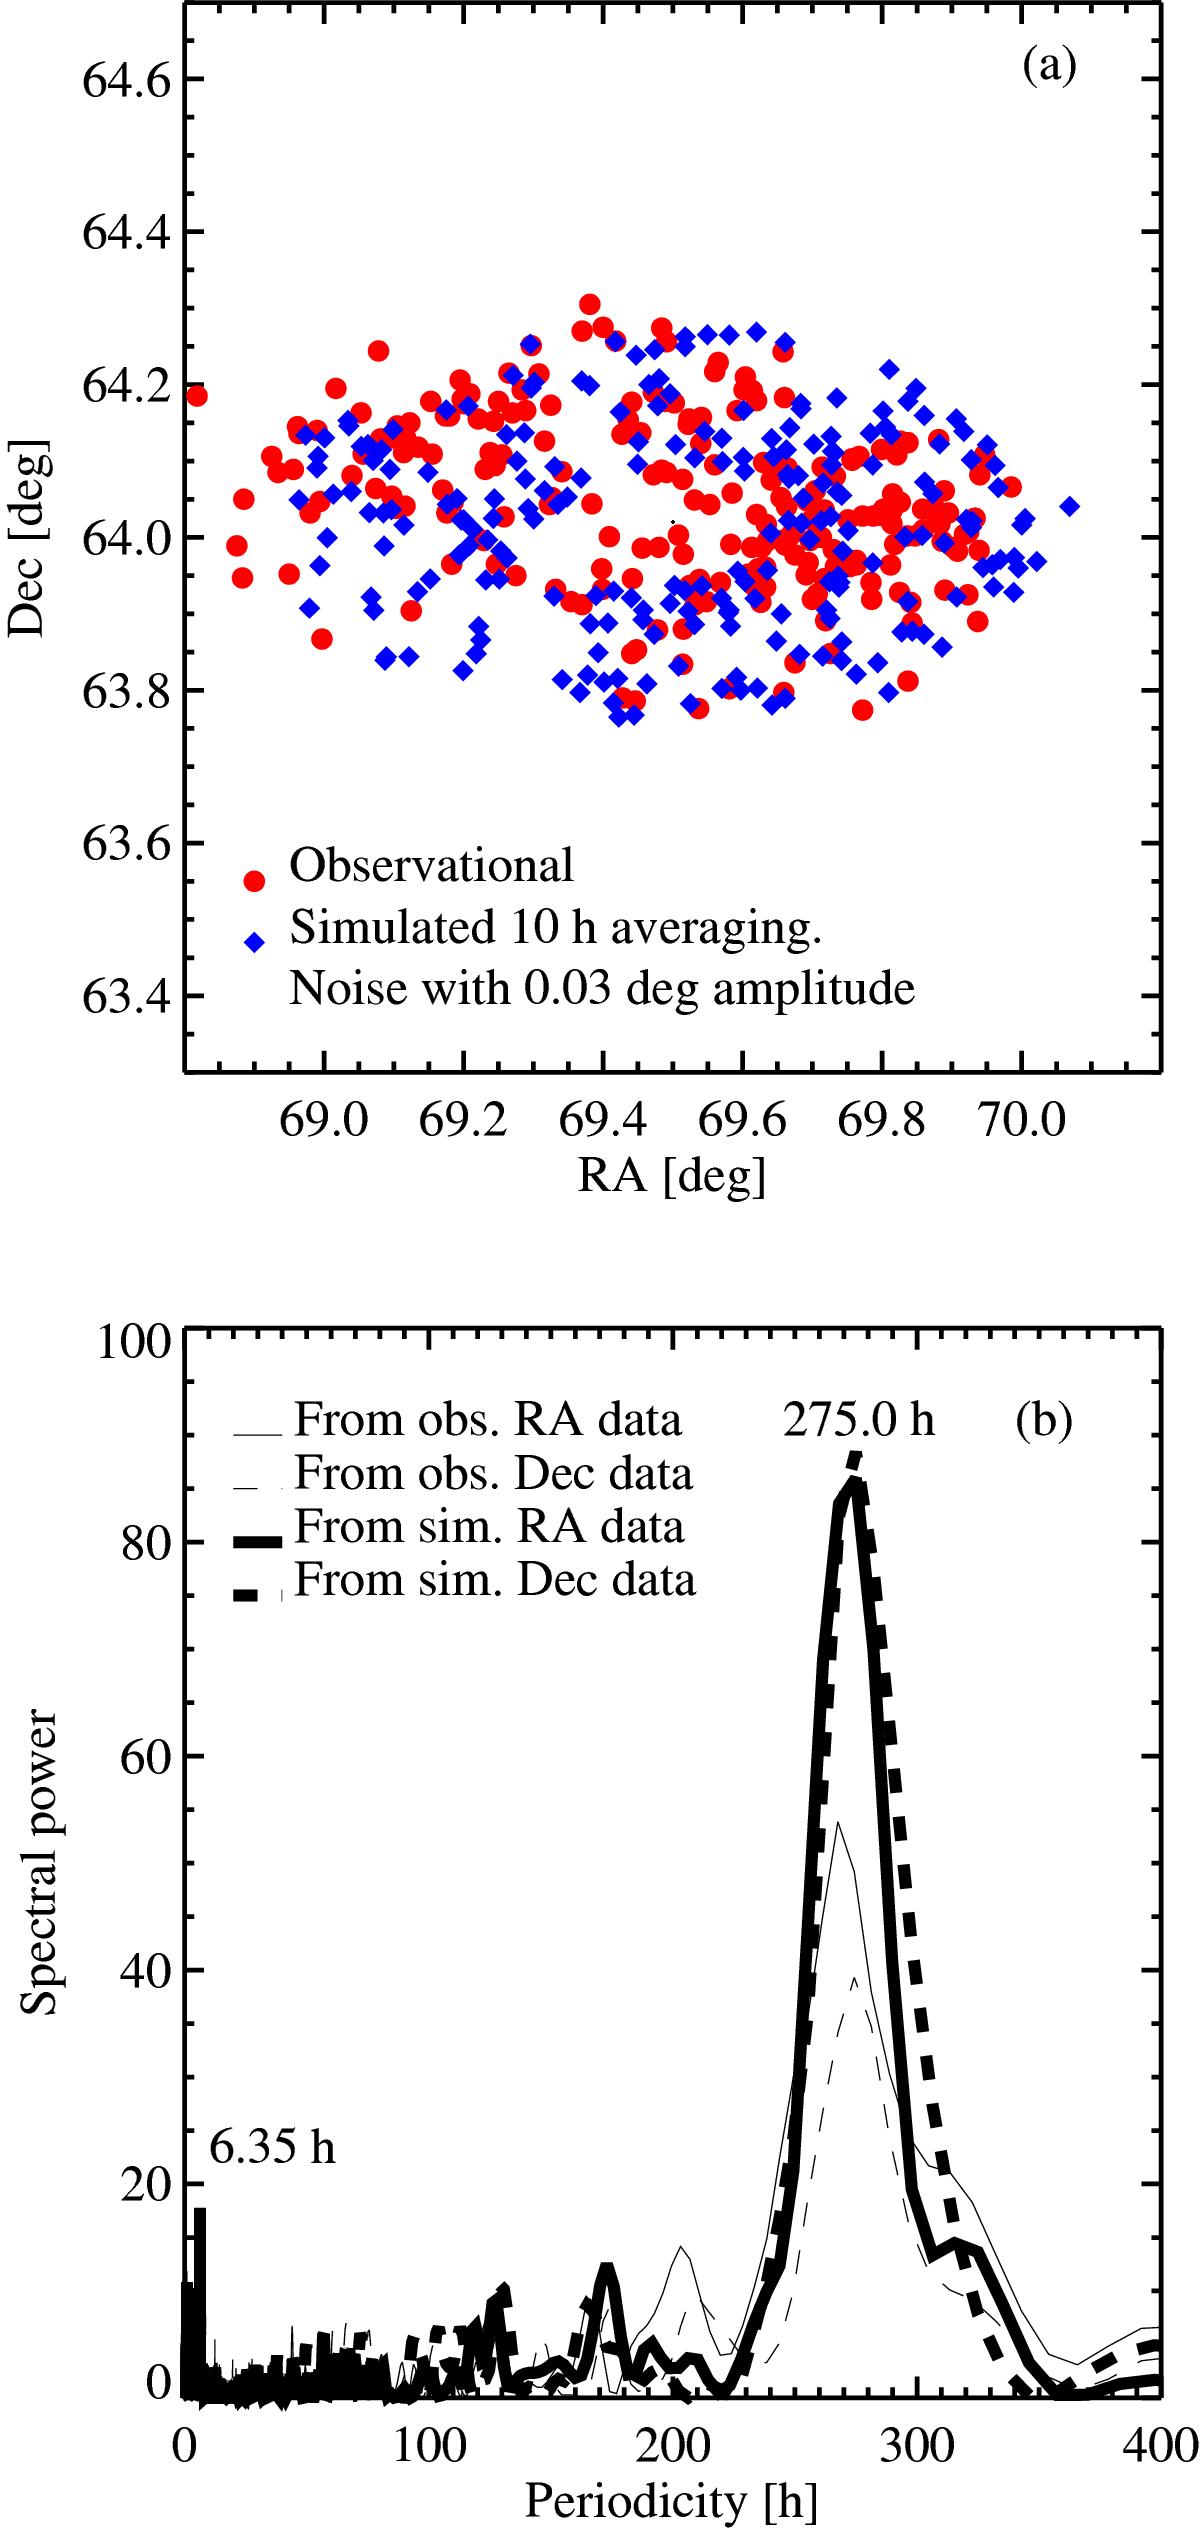
Simulation with the highest K-S probability from the comparison of RA coordinate distributions. a) As previously, bullets (•) show the observationally derived spin axis (Fig. 2). Diamonds (◆) correspond to the simulated spin axis orientation of a body with 1:1.90:2.84, and El = 6.7 × 10⁻⁵ when an averaging of 10 h and a uniformly distributed random noise with an amplitude of 0.03◦ have been considered. b) (Thick lines) Lomb periodograms of the RA and Dec simulated data (diamonds shown in Fig. 10a). The Lomb periodograms of the observationally derived coordinates (Fig. 3) have also been included (with thin lines).
Current usage metrics show cumulative count of Article Views (full-text article views including HTML views, PDF and ePub downloads, according to the available data) and Abstracts Views on Vision4Press platform.
Data correspond to usage on the plateform after 2015. The current usage metrics is available 48-96 hours after online publication and is updated daily on week days.
Initial download of the metrics may take a while.