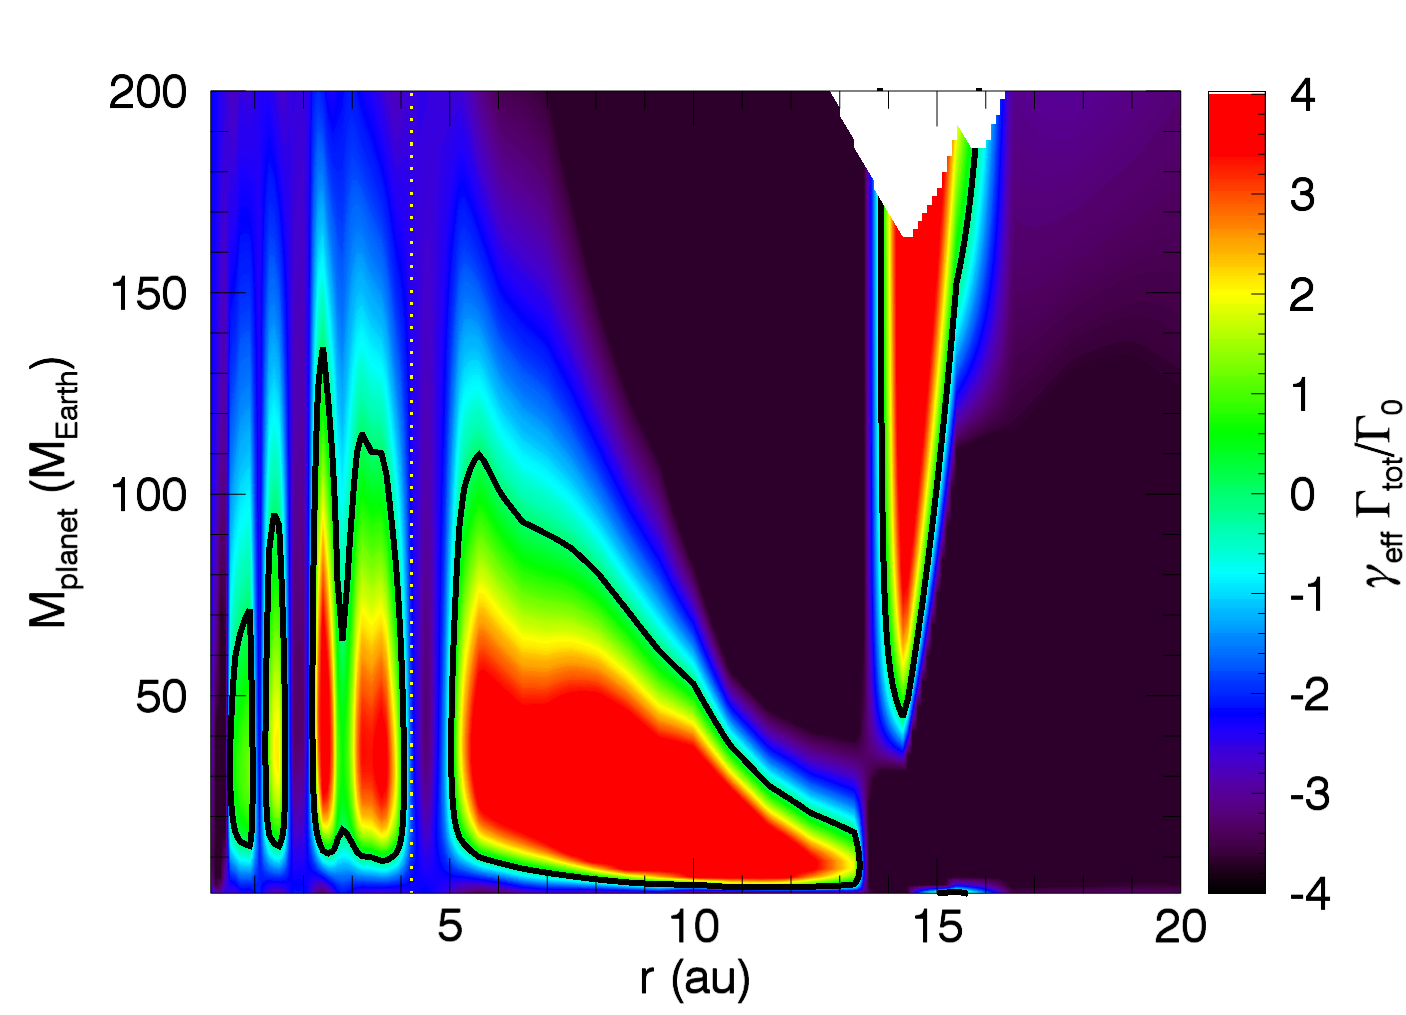
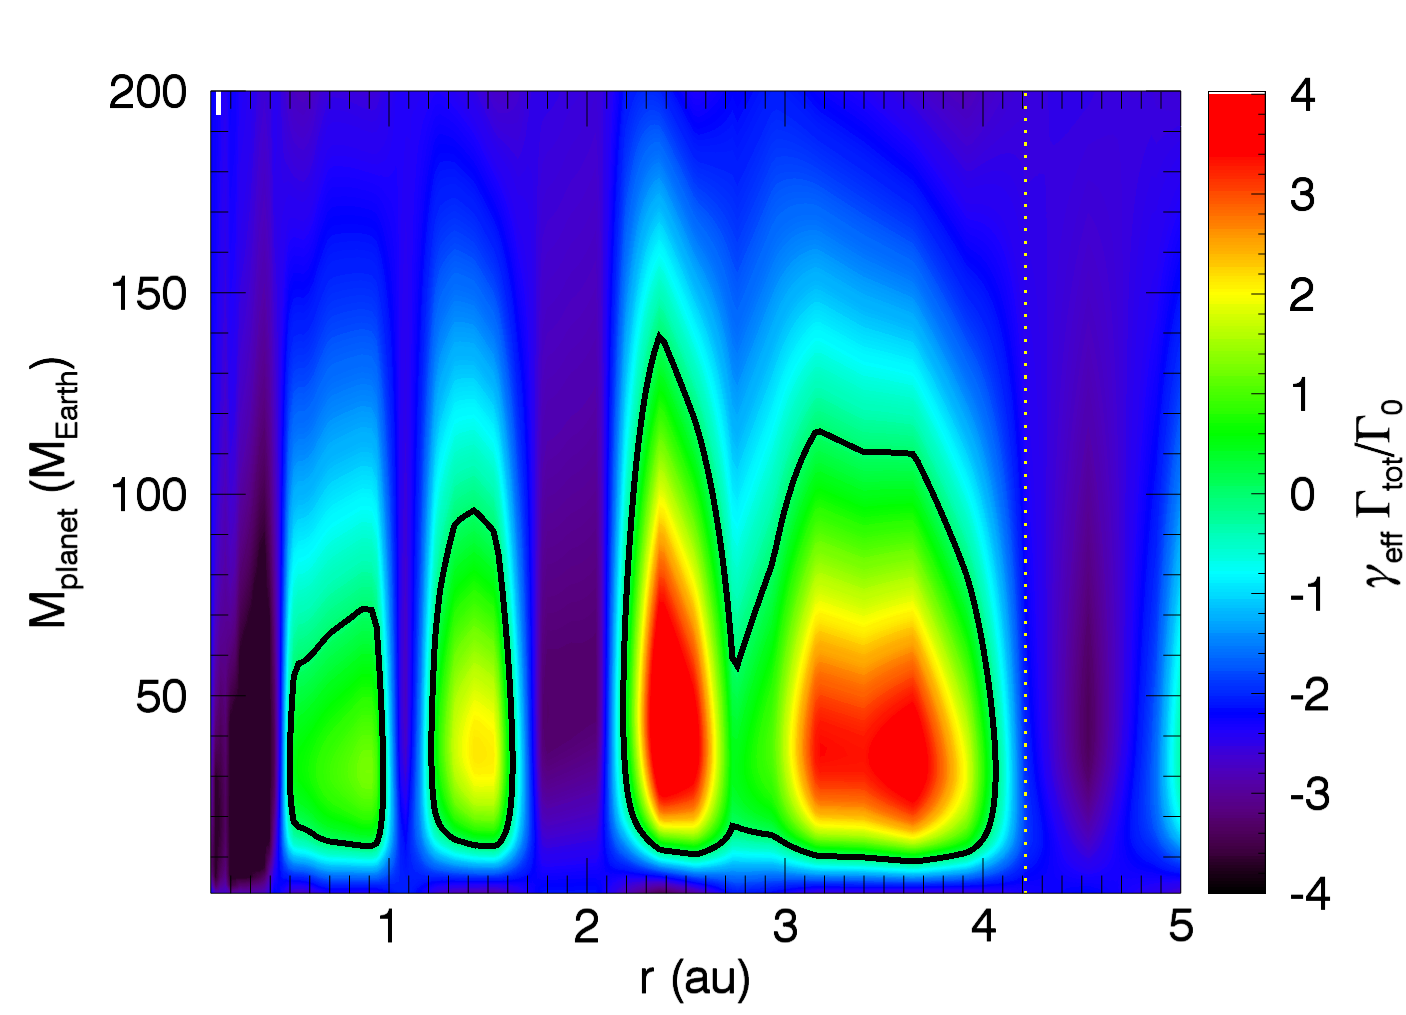
Fig. 3
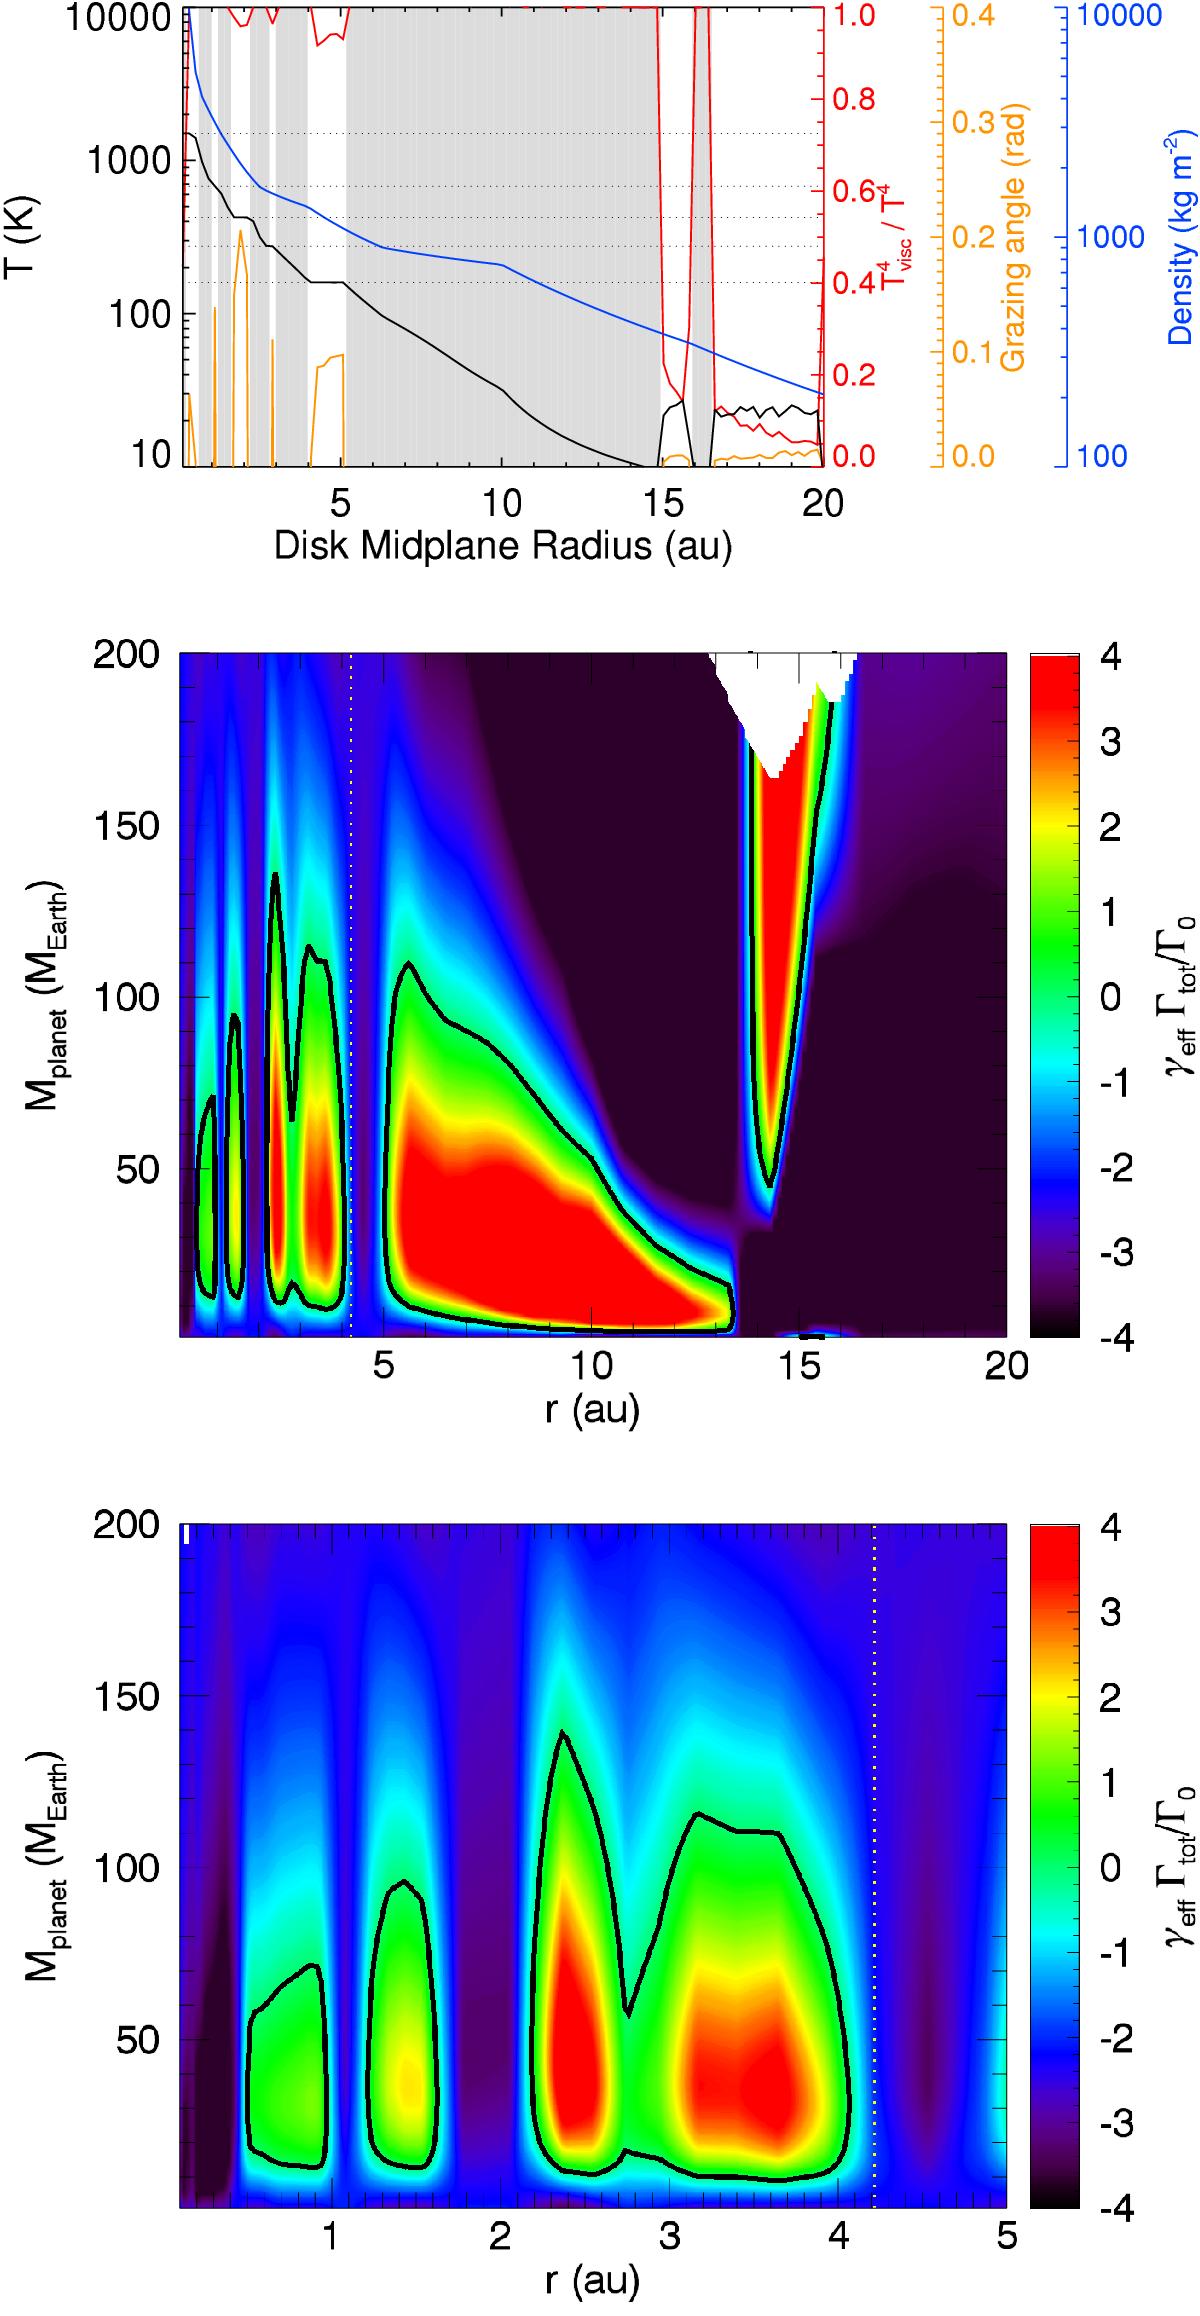
Upper panel: midplane temperature (black), surface-mass density (blue), grazing angle (yellow) and viscous heating rate (red) radial profiles after 10 000 yr of evolution. Shadowed regions are displayed in gray and sublimation lines are shown in dotted lines. Lower panels: migration torque of a protoplanet with given radial distance to the central star rP and mass MP, in a protoplanetary disk after 10 000 yr of evolution. The white area verifies the criterion from Eq. (24). Black contours (0-torque contour) delimit the outward migration conditions while the rest of the migration map shows inward migration. Planetary traps are located at the outer edges of the black contours while planetary deserts are at the inner edges. The yellow dotted line marks the water ice line.

Current usage metrics show cumulative count of Article Views (full-text article views including HTML views, PDF and ePub downloads, according to the available data) and Abstracts Views on Vision4Press platform.
Data correspond to usage on the plateform after 2015. The current usage metrics is available 48-96 hours after online publication and is updated daily on week days.
Initial download of the metrics may take a while.