Fig. 8
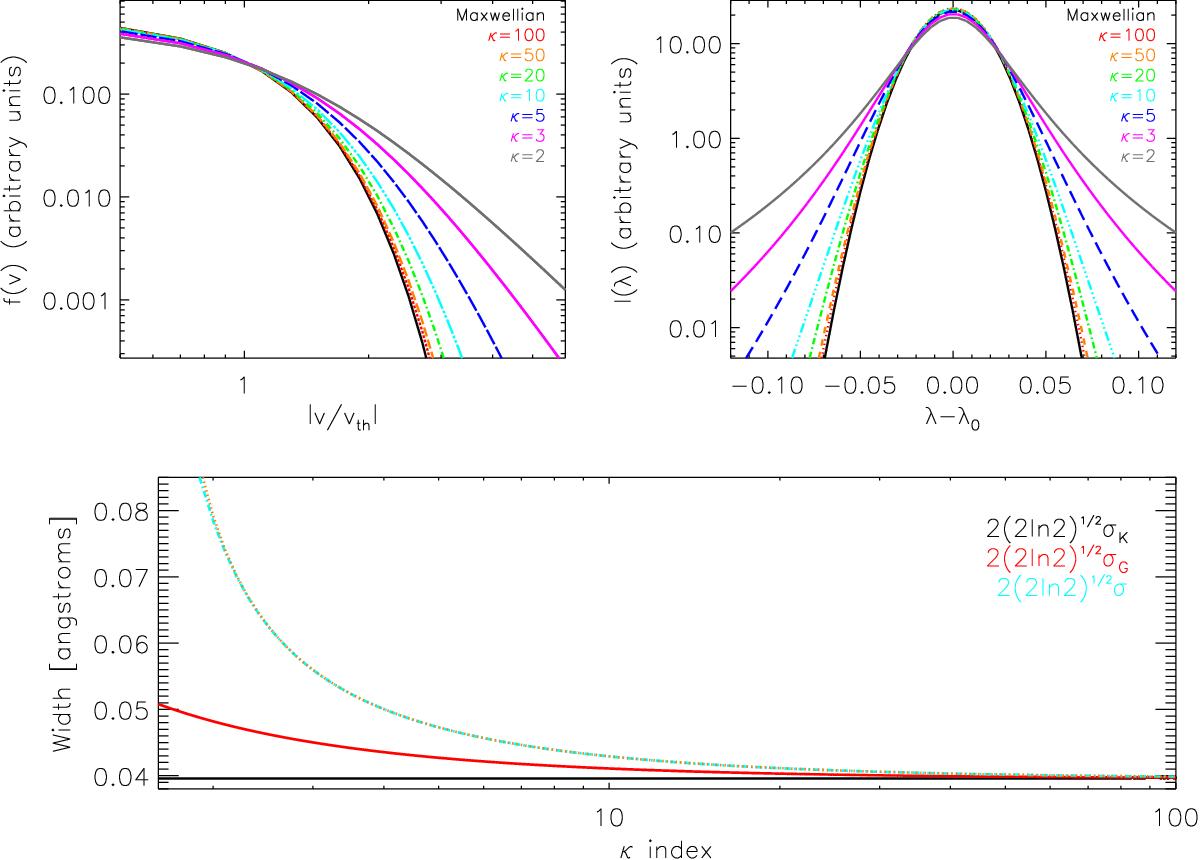
Top left: line of sight ion velocity distribution f(v) plotted against the absolute value of velocity | v/vth |, for a Maxwellian distribution and seven different kappa distributions using κ = 100,50,20,10,5,3,2, using Eq. (11). Top right: corresponding spectral lines produced from each of the ion velocity distributions in the left panel. We use the Fe XVI parameters of log 10T = 6.4 ~ 2.5 MK, iron mass M = 56 × 1.673 × 10-24 g, λ0 = 262.9760 Å and set n = 1 cm-3. The line profile curves all have the same value of σκ and vth, but different values of κ. Bottom: ![]() (black) plotted against κ index. The width is displayed as a “Gaussian FWHM” for easy comparison with a Gaussian line profile. Each kappa line profile is fitted with a single Gaussian and the Gaussian widths are also plotted (
(black) plotted against κ index. The width is displayed as a “Gaussian FWHM” for easy comparison with a Gaussian line profile. Each kappa line profile is fitted with a single Gaussian and the Gaussian widths are also plotted (![]() – red curve) for comparison. The actual line distribution variance σ2 is also shown (displayed as
– red curve) for comparison. The actual line distribution variance σ2 is also shown (displayed as ![]() ) and calculated using σ2 = σκ/(1−3/2κ) (light blue).
) and calculated using σ2 = σκ/(1−3/2κ) (light blue).
Current usage metrics show cumulative count of Article Views (full-text article views including HTML views, PDF and ePub downloads, according to the available data) and Abstracts Views on Vision4Press platform.
Data correspond to usage on the plateform after 2015. The current usage metrics is available 48-96 hours after online publication and is updated daily on week days.
Initial download of the metrics may take a while.