Fig. 7
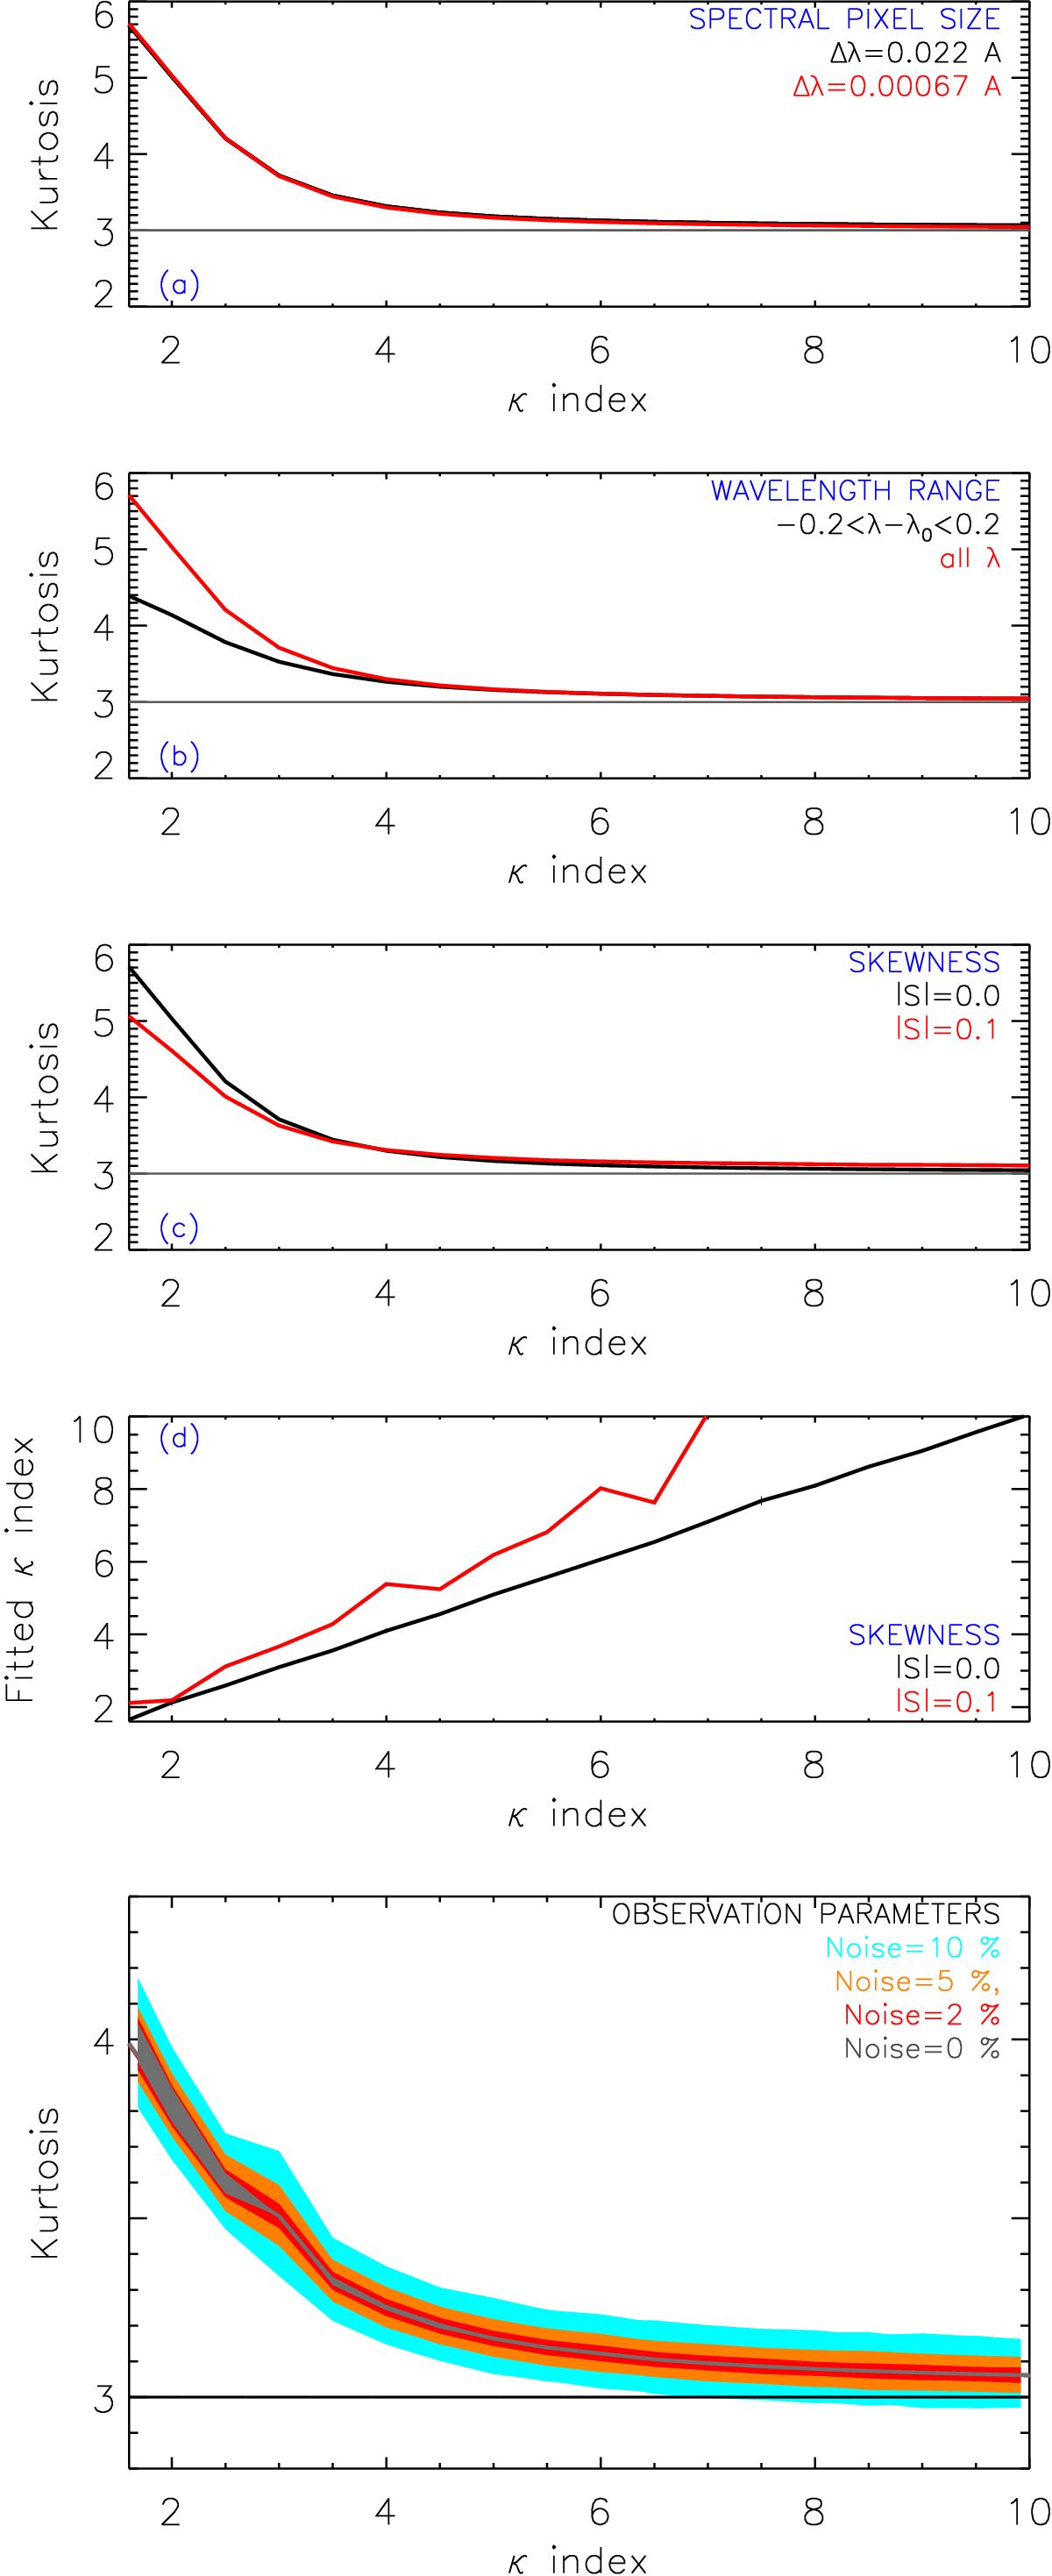
Rows 1−3: kurtosis value (from a moments analysis) versus the κ index of a modelled spectral line, showing differences in the inferred values of kurtosis due to a) spectral pixel size; b) chosen wavelength range; and c) skewness. In each plot, ideal parameters are used and one variable is changed (plot legend) to match the EIS value. Row 4: κ index found from line fitting versus the κ index of a modelled spectral line. Line skewness can change the values of κ index found from line fitting. Row 5: kurtosis versus modelled κ index, as rows 1−3, but now the collective effects of all sources of uncertainty are shown together using the EIS spectral pixel size (Δλ = 0.022 Å), the observed wavelength range of λ0 ± 0.2 Å and a skewness equal to 0, for different noise levels of 0%, 2%, 5%, and 10%.
Current usage metrics show cumulative count of Article Views (full-text article views including HTML views, PDF and ePub downloads, according to the available data) and Abstracts Views on Vision4Press platform.
Data correspond to usage on the plateform after 2015. The current usage metrics is available 48-96 hours after online publication and is updated daily on week days.
Initial download of the metrics may take a while.