Fig. 6
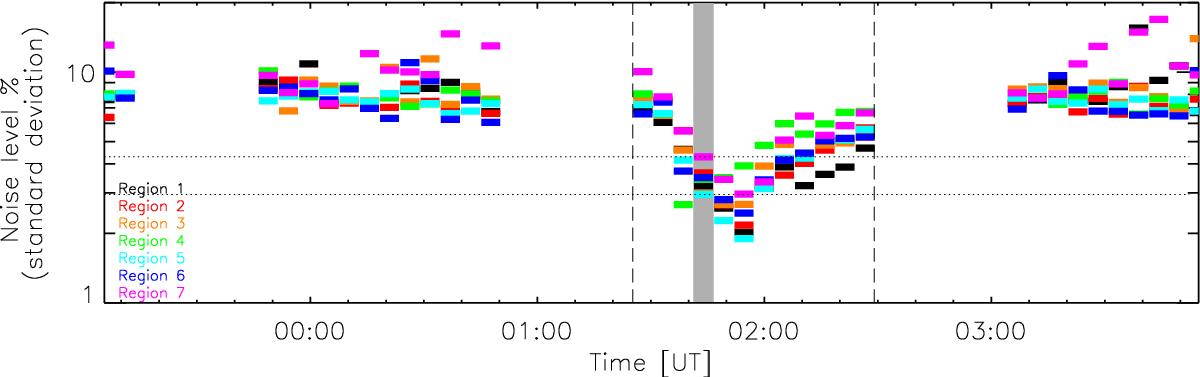
Noise level associated with each Fe XVI spectral line at all times in regions 1 to 7. A 1-sigma Gaussian noise level for each region at each time is calculated using noise(%) = STD(ϵ/I) × 100. As expected the noise level falls as the line intensity increases during the flare times of ~01:25 UT to 02:30 UT. The 1-sigma noise level is less than 10% during all flare times, and as low as 2% during peak flare times. Our studied flare time of 01:41:16 UT is shown by the grey band, with noise levels between ~3−5% (shown by the black dotted lines).
Current usage metrics show cumulative count of Article Views (full-text article views including HTML views, PDF and ePub downloads, according to the available data) and Abstracts Views on Vision4Press platform.
Data correspond to usage on the plateform after 2015. The current usage metrics is available 48-96 hours after online publication and is updated daily on week days.
Initial download of the metrics may take a while.