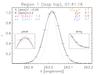
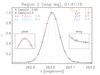
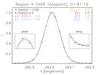
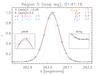
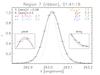
Fig. 5
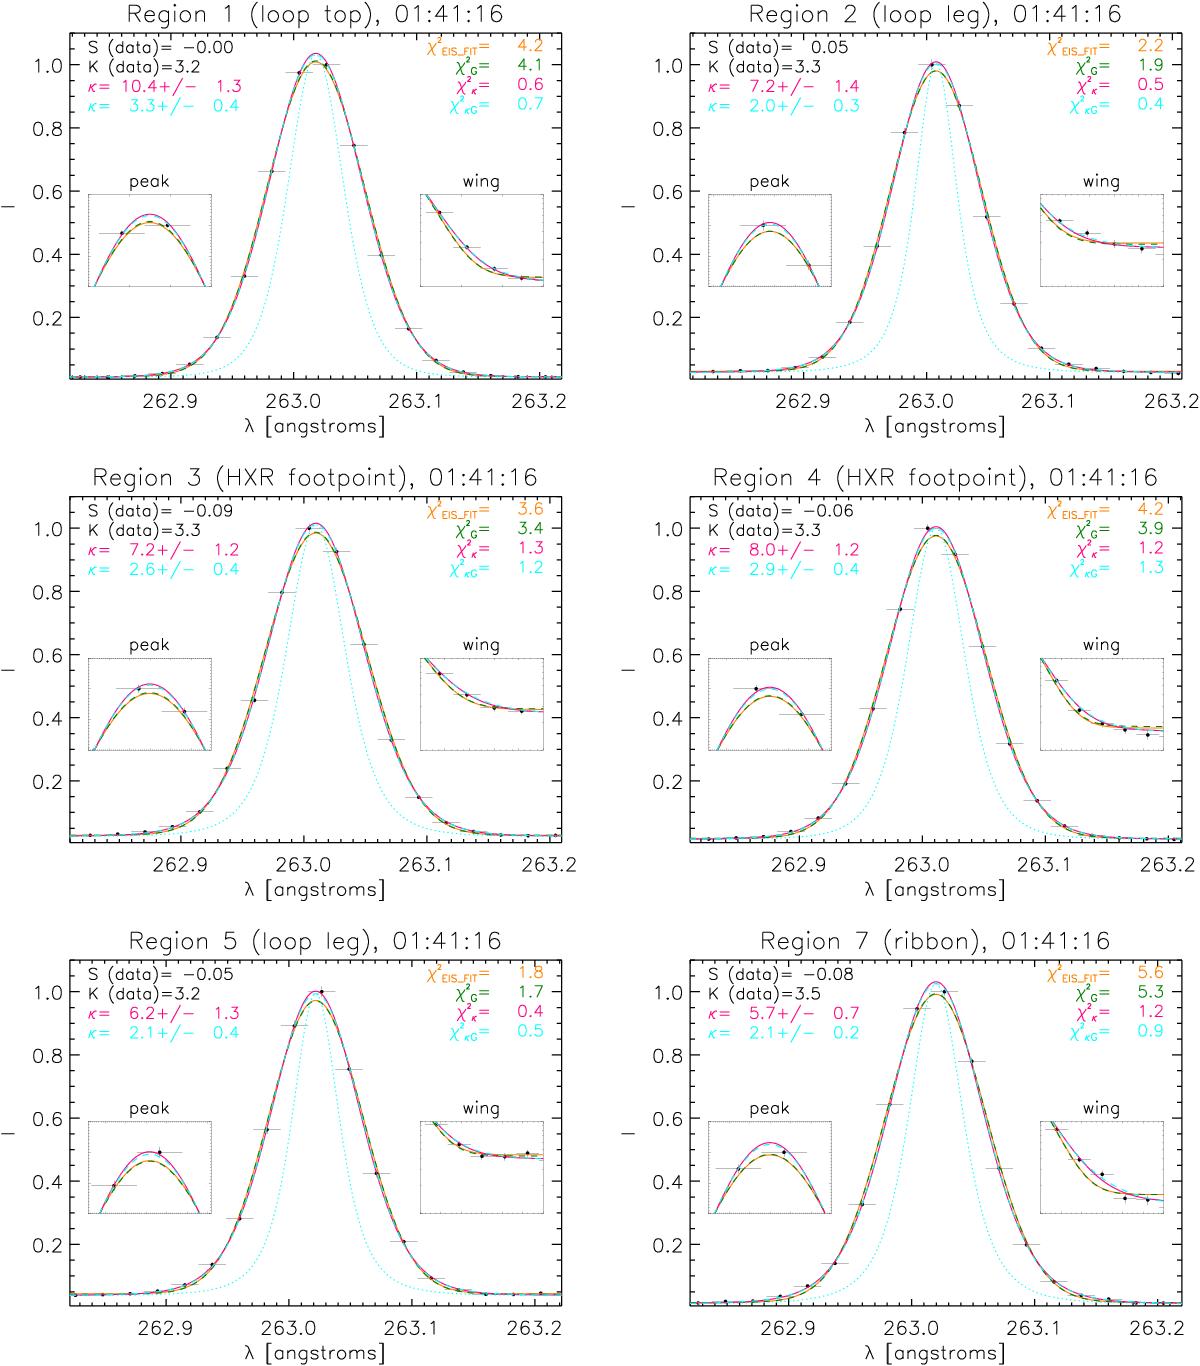
Fe XVI line profiles (total observed profile) for the regions of 1, 2, 3, 4, 5, and 7. The peak of each line is set to 1 by dividing by the maximum value. Many of the lines are “more peaked” and have broader wings, which is consistent with a physical line profile closer to a kappa distribution than a Gaussian. Small panels on the main plots show the peaks and wings more clearly. The following fits are shown: orange: Gaussian from eis_auto_fit, green: Gaussian fit, pink: kappa fit, blue: convolved kappa-Gaussian fit. The reduced χ2 values for each fit are shown on each panel. The skewness (S) and kurtosis (K) from the moments analysis, and the κ values of each fit, are also shown. The dotted blue lines represent the inferred physical kappa line profiles from the convolved kappa-Gaussian fits.
Current usage metrics show cumulative count of Article Views (full-text article views including HTML views, PDF and ePub downloads, according to the available data) and Abstracts Views on Vision4Press platform.
Data correspond to usage on the plateform after 2015. The current usage metrics is available 48-96 hours after online publication and is updated daily on week days.
Initial download of the metrics may take a while.