Fig. 4
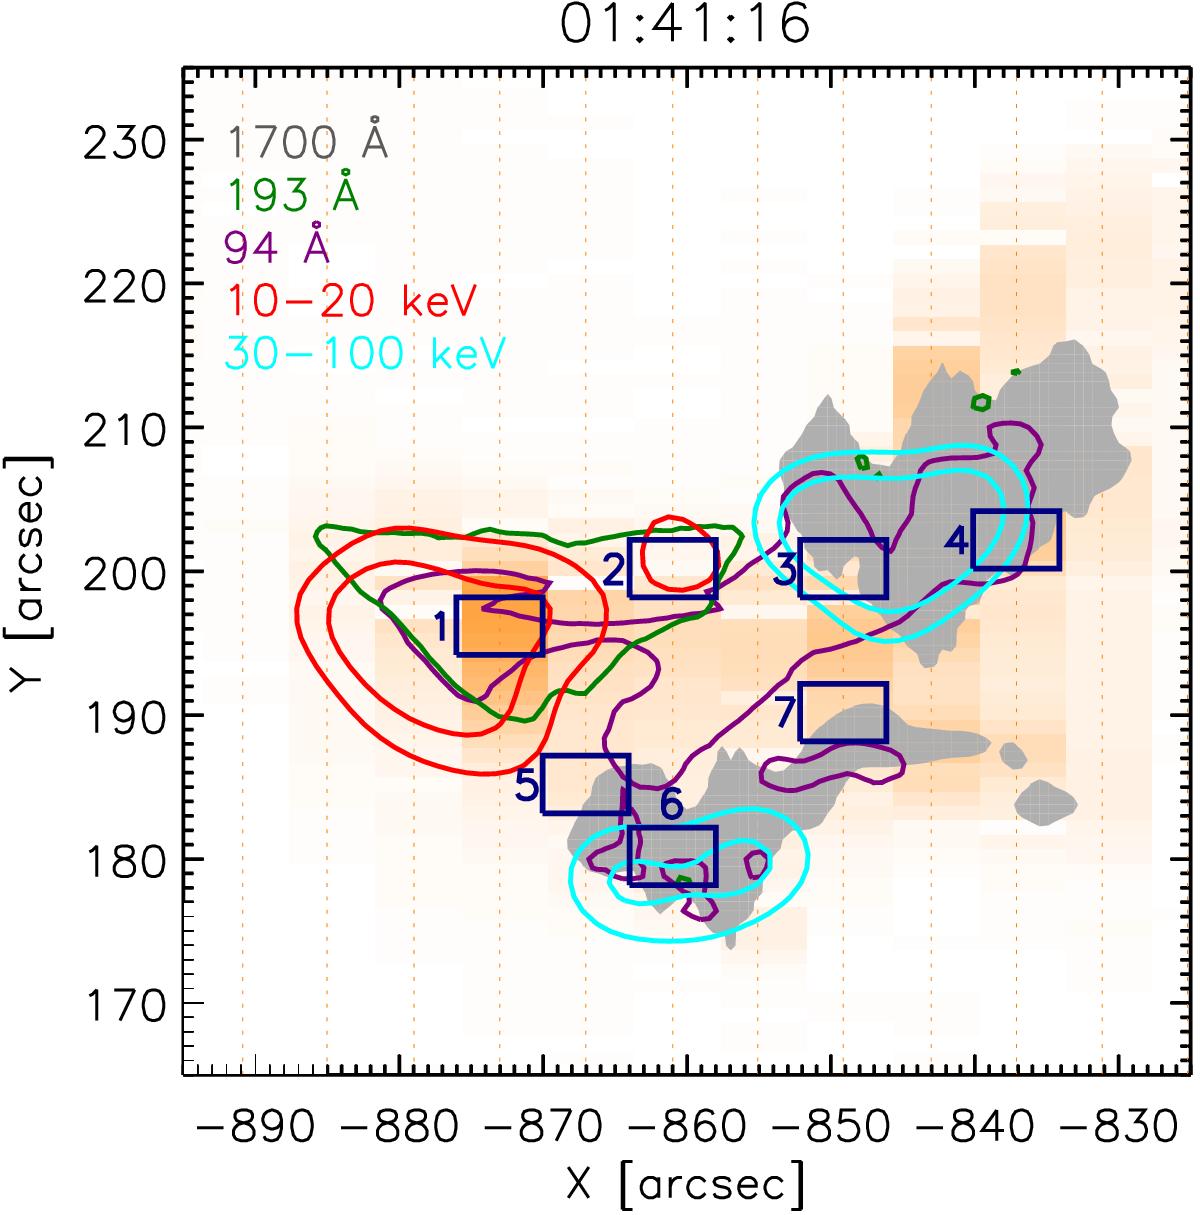
Background EIS integrated intensity raster images for Fe XVI at 262.9760 Å. The features of the flare are displayed using AIA 1700 Å (grey), 193 Å (green) and RHESSI 10−20 keV (red) and 30−100 keV (blue) contours, for the EIS raster start time of 01:41:16 UT, close to the peak of the flare. Seven regions of study are chosen and they are denoted on the figure as the rectangles 1 to 7. The spatially integrated spectral properties of Fe XVI within each rectangular region are studied.
Current usage metrics show cumulative count of Article Views (full-text article views including HTML views, PDF and ePub downloads, according to the available data) and Abstracts Views on Vision4Press platform.
Data correspond to usage on the plateform after 2015. The current usage metrics is available 48-96 hours after online publication and is updated daily on week days.
Initial download of the metrics may take a while.