Fig. 3
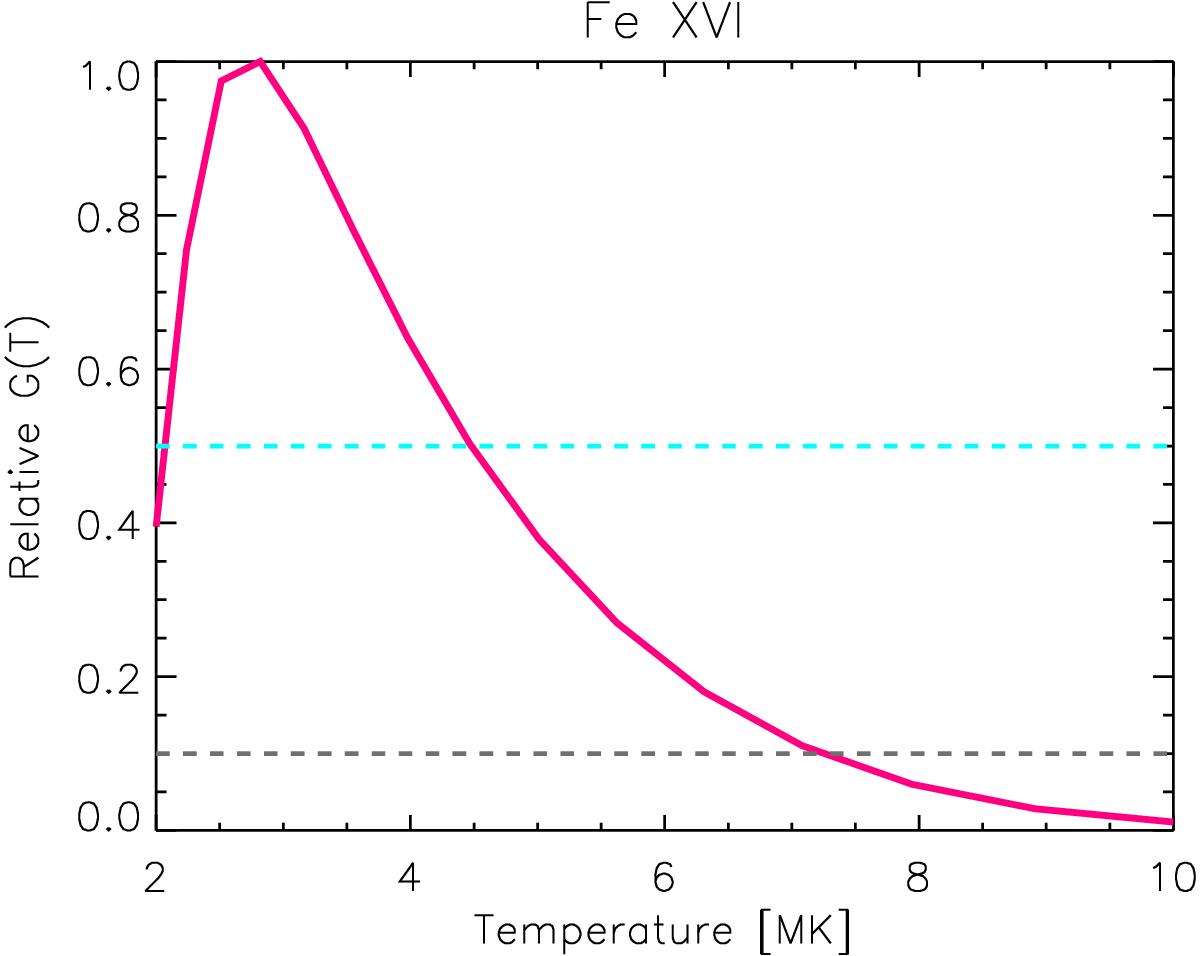
Relative contribution function G(T) (i.e. peak set to 1) for Fe XVI 262.9760 Å plotted using CHIANTI. Fe XVI is mainly formed over the temperatures of 2 to 4 MK. Over these temperatures, Fe XVI G(T) values are greater than half of the maximum contribution value, showing that Fe XVI is easily formed over this temperature range. The G(T) curve is similar for both coronal and photospheric abundances.
Current usage metrics show cumulative count of Article Views (full-text article views including HTML views, PDF and ePub downloads, according to the available data) and Abstracts Views on Vision4Press platform.
Data correspond to usage on the plateform after 2015. The current usage metrics is available 48-96 hours after online publication and is updated daily on week days.
Initial download of the metrics may take a while.