Fig. 2
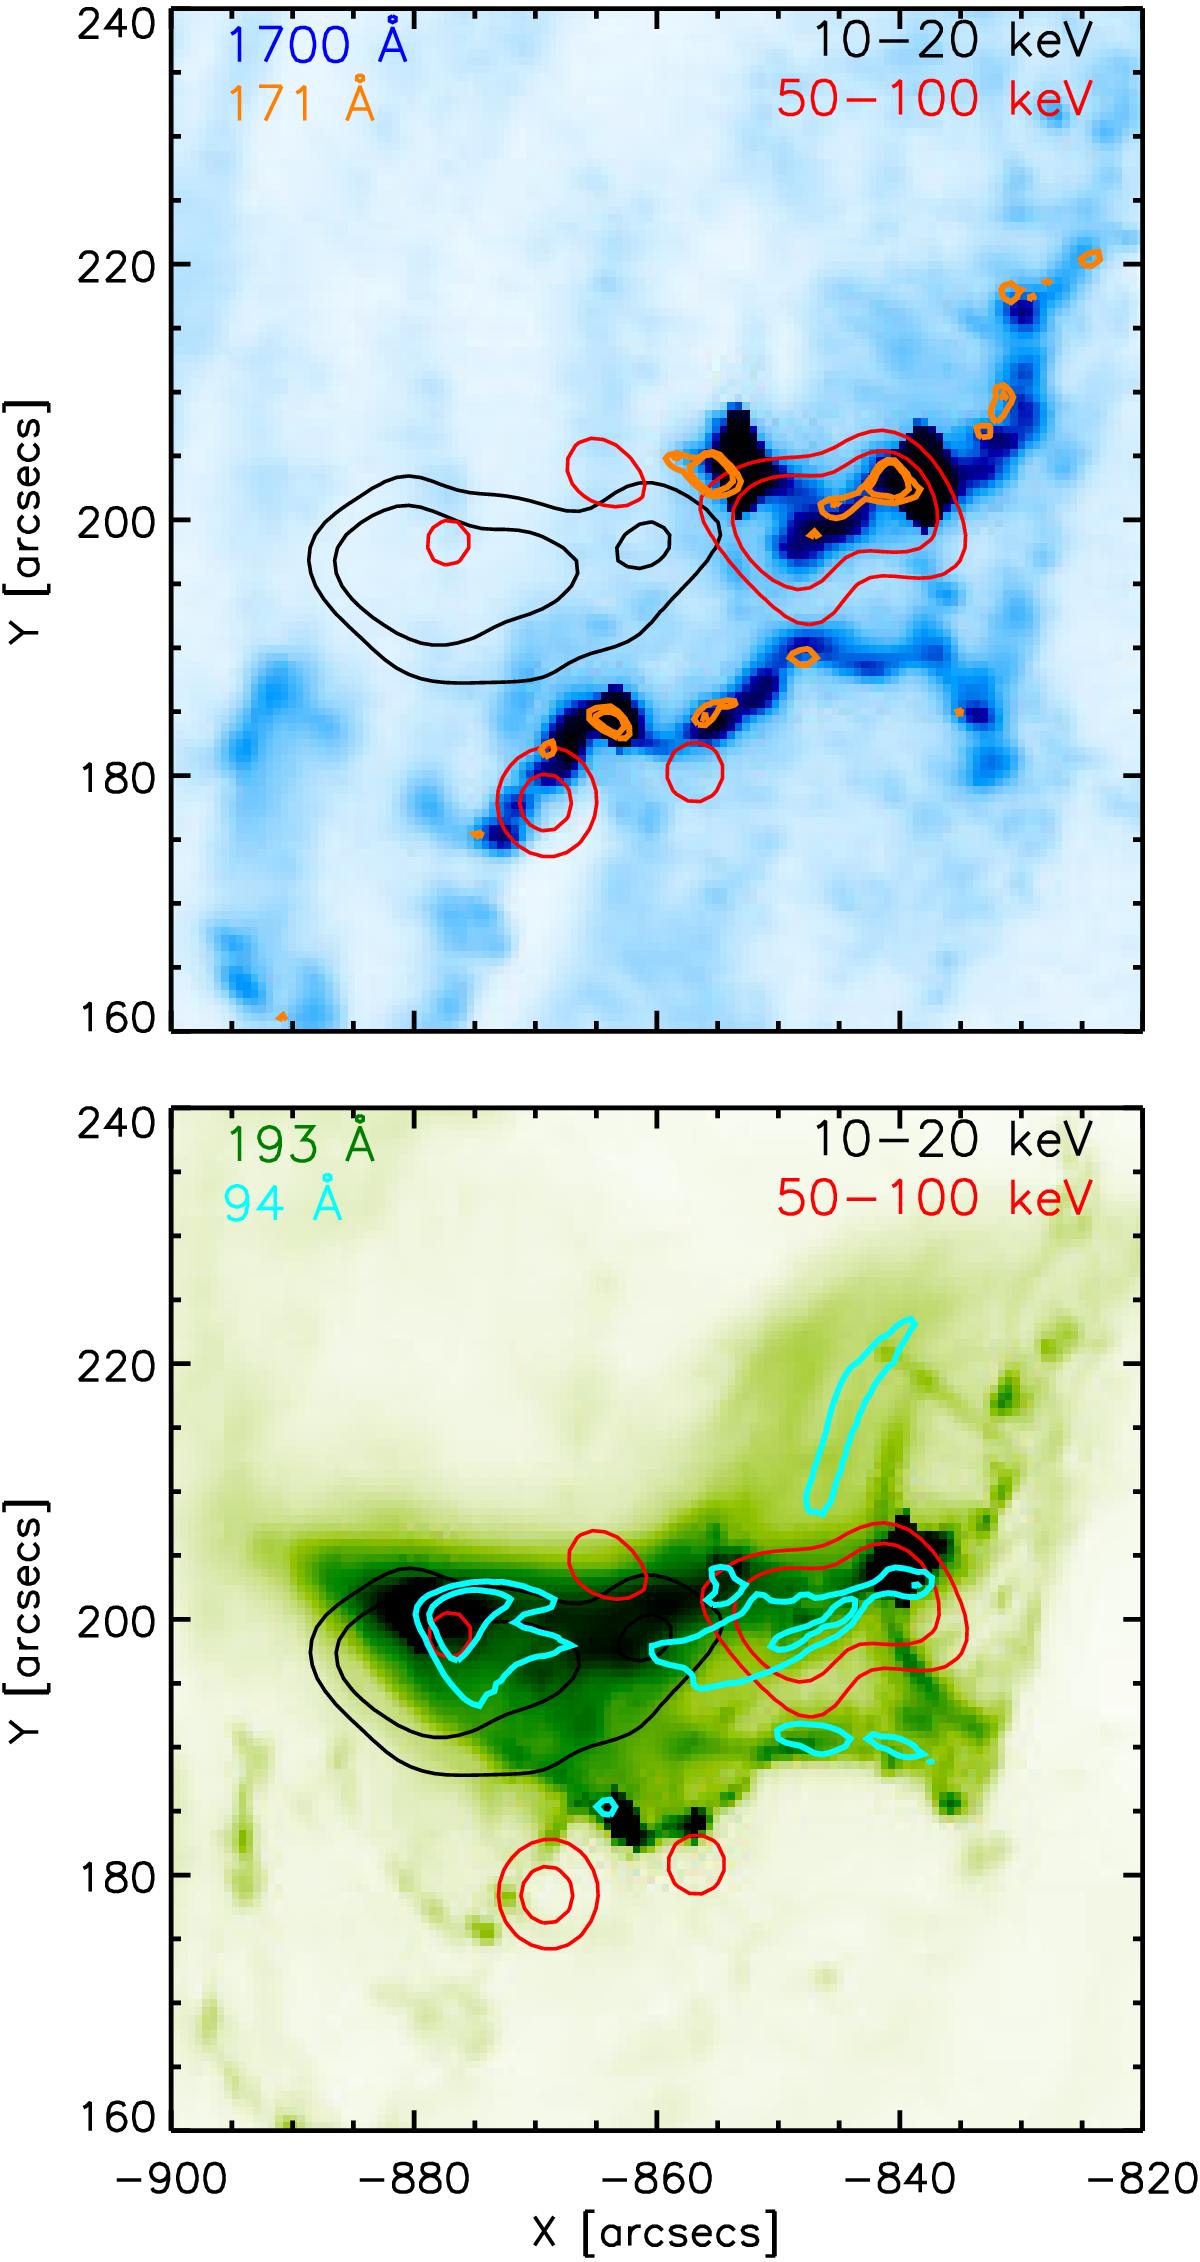
SDO AIA images of SOL2013-05-15T01:45 in 1700 Å (top) and 193 Å (bottom). 1700 Å shows the positions of the ribbons clearly. AIA contours at 171 Å and 94 Å are displayed at 30% and 50% of the maximum. RHESSI X-ray contours are also displayed showing the positions of a loop-top source (black) and hard X-ray footpoints (red) at 30% and 50% of the maximum. The RHESSI X-ray contours are shown for a time interval of 01:37 to 01:38 UT, while the AIA images are from various times between this interval.
Current usage metrics show cumulative count of Article Views (full-text article views including HTML views, PDF and ePub downloads, according to the available data) and Abstracts Views on Vision4Press platform.
Data correspond to usage on the plateform after 2015. The current usage metrics is available 48-96 hours after online publication and is updated daily on week days.
Initial download of the metrics may take a while.