Fig. 1
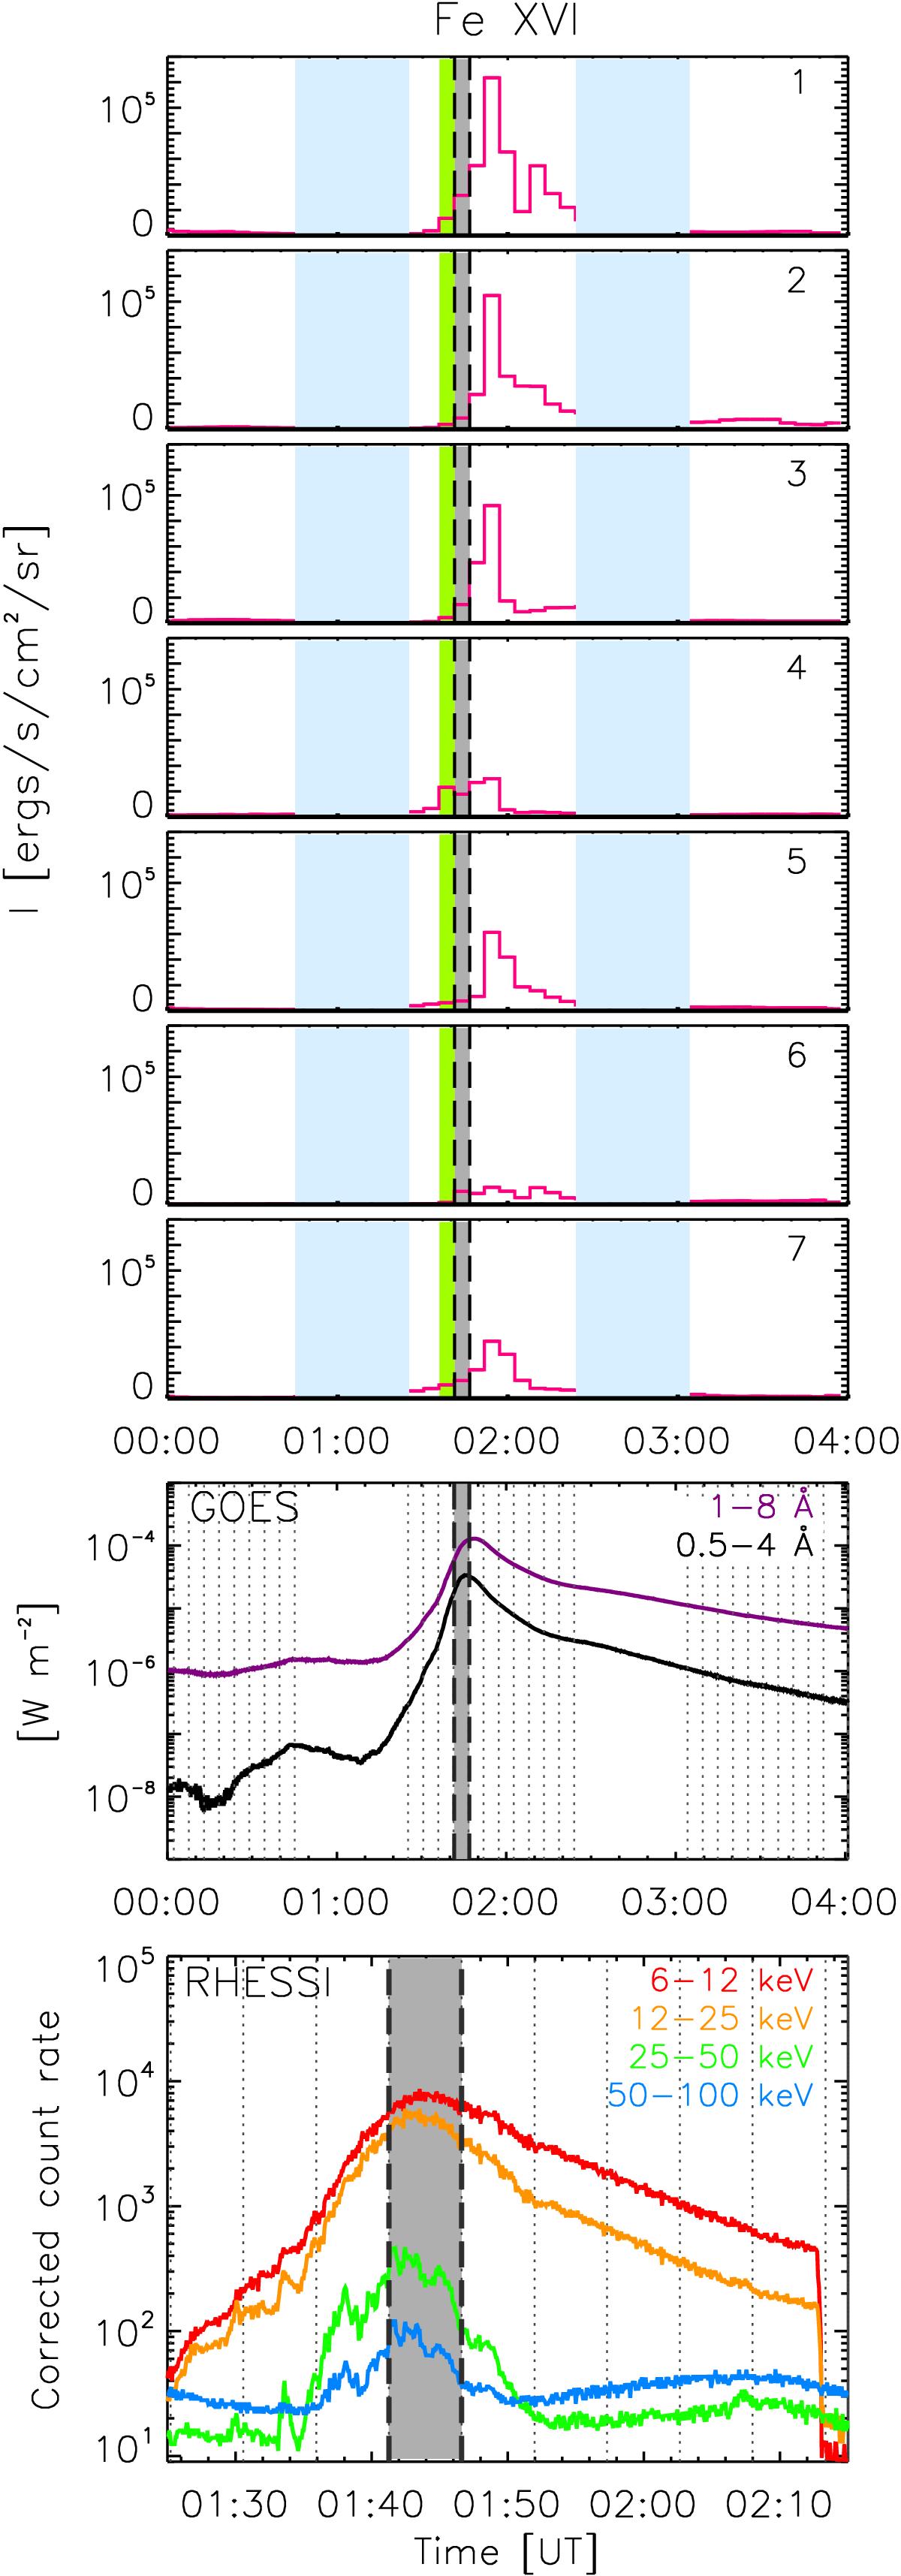
GOES (middle) and RHESSI (bottom) lightcurves for SOL2013-05-15T01:45. The GOES lightcurve is shown for a longer period before, during and after the flare. The RHESSI lightcurve is shown for the flare times from ~01:25 to 02:15 UT. The grey dotted lines indicate the start times of an EIS raster observation. The top seven panels show the Fe XVI integrated intensity (1. corona; 2. loop leg; 3. and 4. HXR footpoint; 5. loop leg; 6. HXR footpoint; and 7. ribbon only) of the flare (see Fig. 4). Dark grey band – time of study, green band – HXR peak, blue bands – no EIS data.
Current usage metrics show cumulative count of Article Views (full-text article views including HTML views, PDF and ePub downloads, according to the available data) and Abstracts Views on Vision4Press platform.
Data correspond to usage on the plateform after 2015. The current usage metrics is available 48-96 hours after online publication and is updated daily on week days.
Initial download of the metrics may take a while.