Fig. A.2
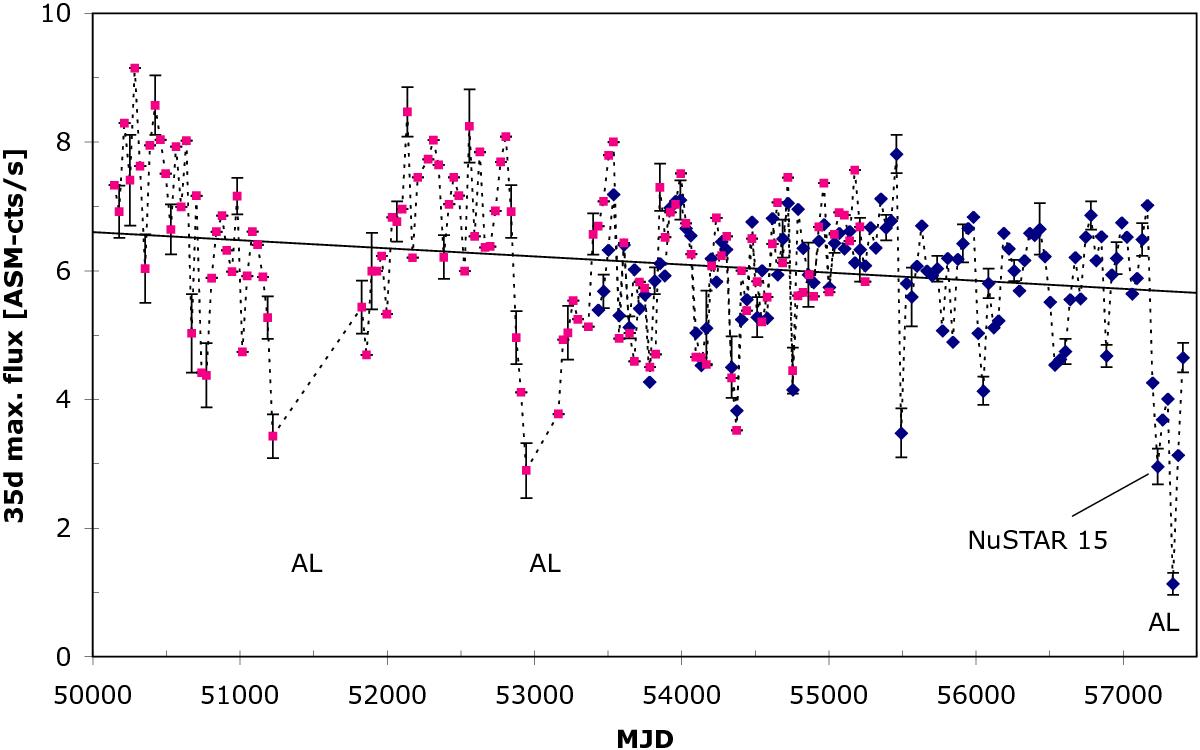
Her X-1 long-term light curve, showing the maximum flux of each 35 d cycle in units of ASM-cts/s, as determined from observations by the monitoring instruments: red points are from RXTE/ASM, blue points are from Swift/BAT. Measured BAT values (in units of cts/(cm2 s)) were scaled to ASM-cts/s using the scaling factor determined from the overlapping time period (MJD 53 433–55 248). For better readability of the light curve, only a few error bars are shown. Three anomalous lows (Coburn et al. 2000) can be recognized (indicated by AL). The rather low flux value of the latest NuSTAR observation is also marked (NuSTAR 15). The solid line is a linear fit to the data (excluding those points belonging to the ALs). Its slope is −(1.30 ± 0.09) × 10-4 (ASM-cts/s)/d, which corresponds to a small reduction in flux of (0.95 ± 0.07) ASM-cts/s over 20 yr.
Current usage metrics show cumulative count of Article Views (full-text article views including HTML views, PDF and ePub downloads, according to the available data) and Abstracts Views on Vision4Press platform.
Data correspond to usage on the plateform after 2015. The current usage metrics is available 48-96 hours after online publication and is updated daily on week days.
Initial download of the metrics may take a while.