Fig. A.1
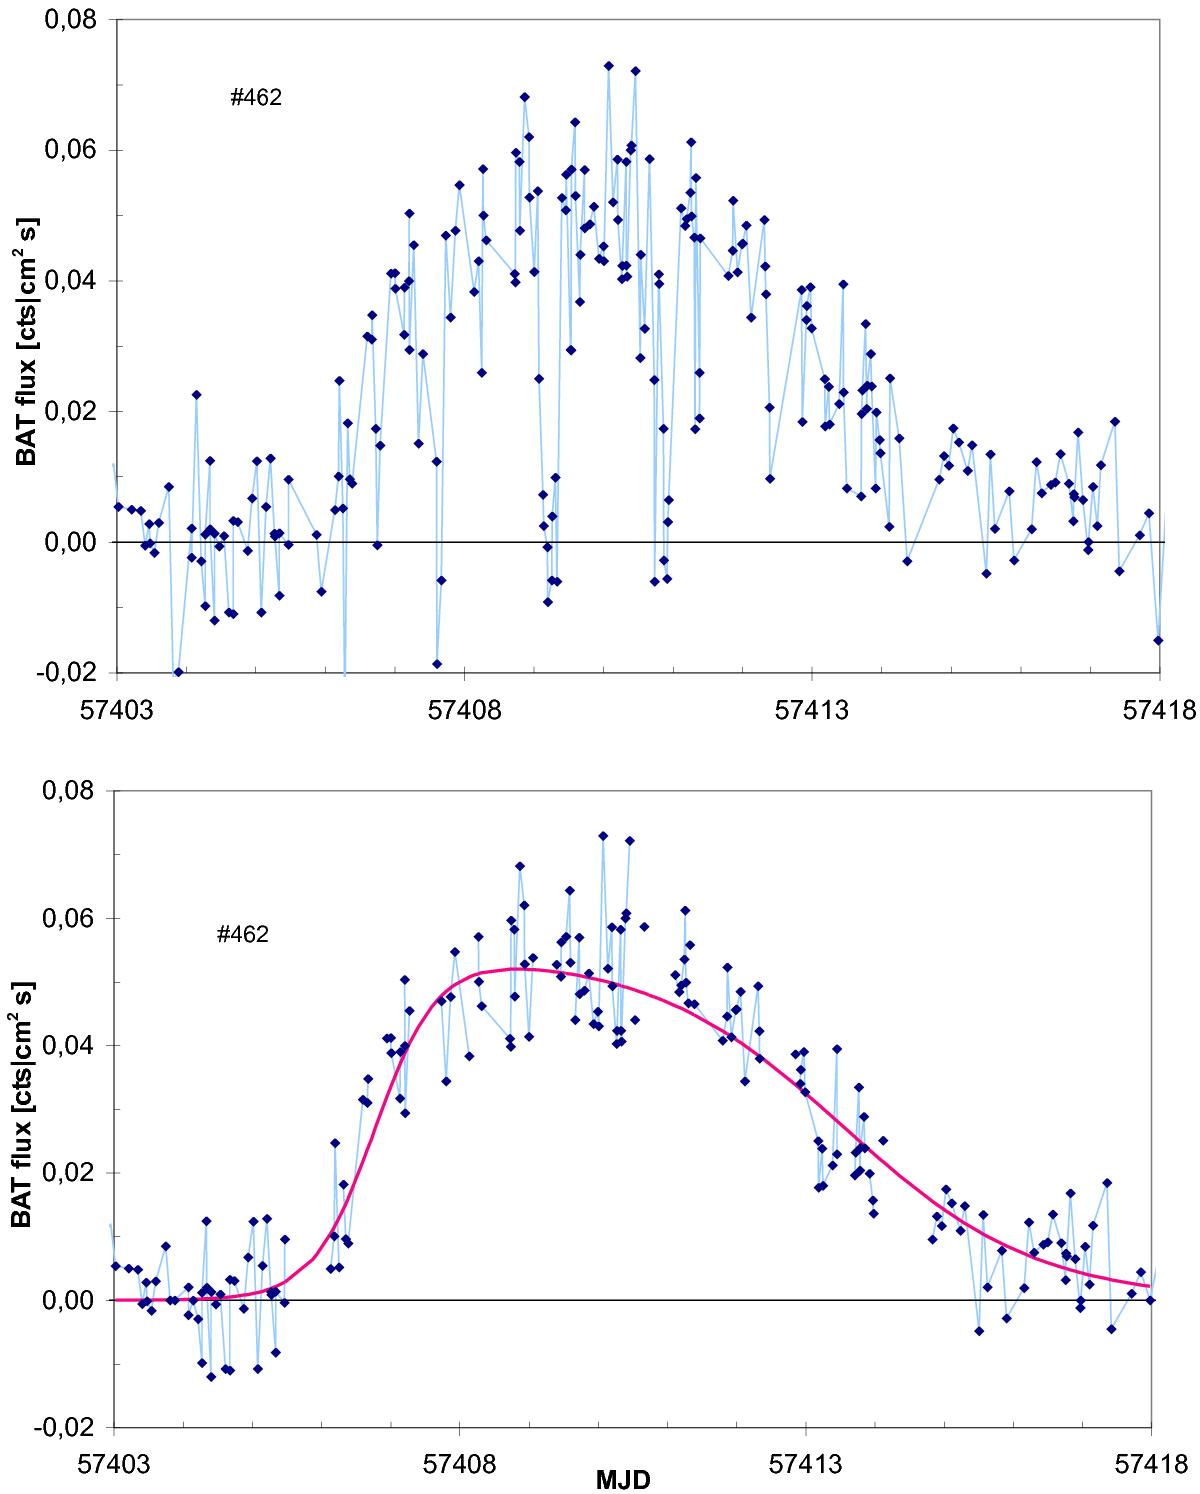
Her X-1 light curve for the Main-On of 35 d cycle 462, representing orbital averages as observed by Swift/BAT. Upper panel: observed flux values. Lower panel: cleaned data with points during binary eclipses and dips, and extreme outliers, removed. Uncertainties of individual measurements around the maximum flux are of the order of 20%. The solid red line is the best fit function as defined in the text (Eq. (A.1)). The maximum flux for this 35 d cycle is 0.052 ± 0.002 BAT-cts/(cm2 s).
Current usage metrics show cumulative count of Article Views (full-text article views including HTML views, PDF and ePub downloads, according to the available data) and Abstracts Views on Vision4Press platform.
Data correspond to usage on the plateform after 2015. The current usage metrics is available 48-96 hours after online publication and is updated daily on week days.
Initial download of the metrics may take a while.