Fig. 1
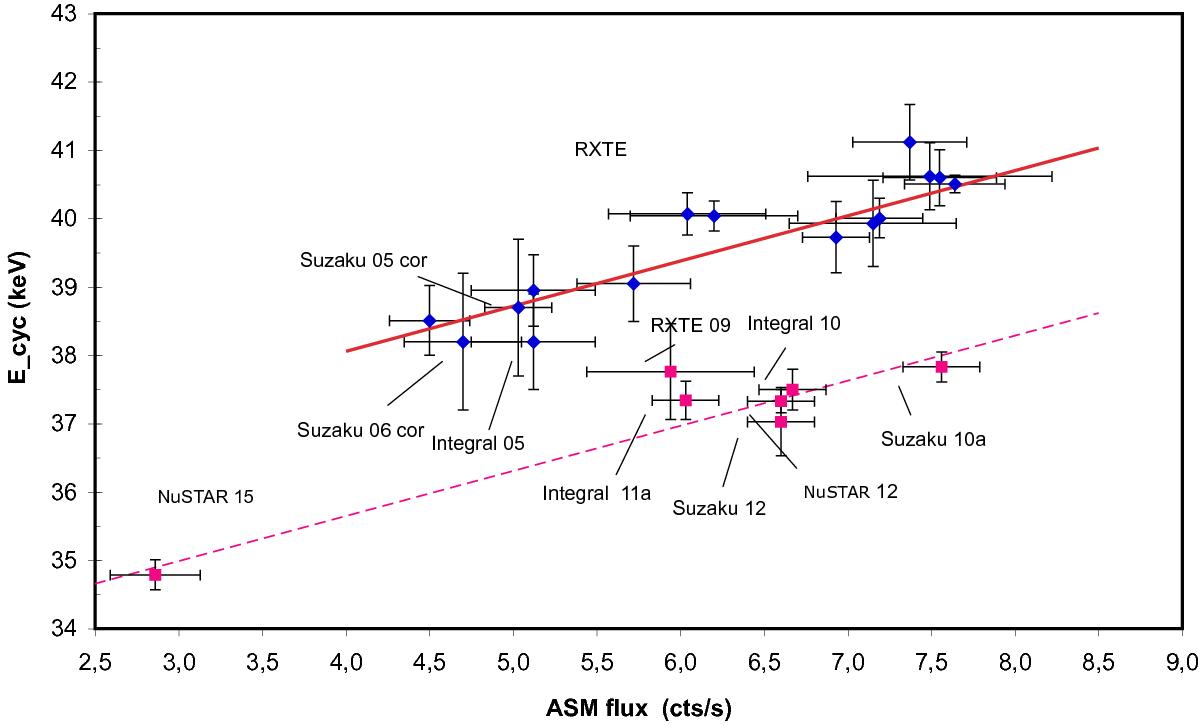
Positive correlation between the cyclotron line energy and the maximum X-ray flux of the corresponding 35-day cycle. Here, Fig. 1 of Paper I is reproduced with the new NuSTAR point added: Ecyc(observed)= 34.79 ± 0.22 keV. The blue diamonds are values observed until 2006, the red dots are after 2006. The solid red line is a linear fit to data until 2006 with the original slope of 0.66 keV/(ASM cts/s), as found by Staubert et al. (2007). The dotted red line is the best fit to the data after 2006 with the slope fixed to the same value. The flux level of the new observation (2.96 ASM-cts/s) is very low, extending the dynamic range of observed fluxes to the low end (missing for the time after 2006). The new value fits well into the general picture.
Current usage metrics show cumulative count of Article Views (full-text article views including HTML views, PDF and ePub downloads, according to the available data) and Abstracts Views on Vision4Press platform.
Data correspond to usage on the plateform after 2015. The current usage metrics is available 48-96 hours after online publication and is updated daily on week days.
Initial download of the metrics may take a while.