Fig. 8
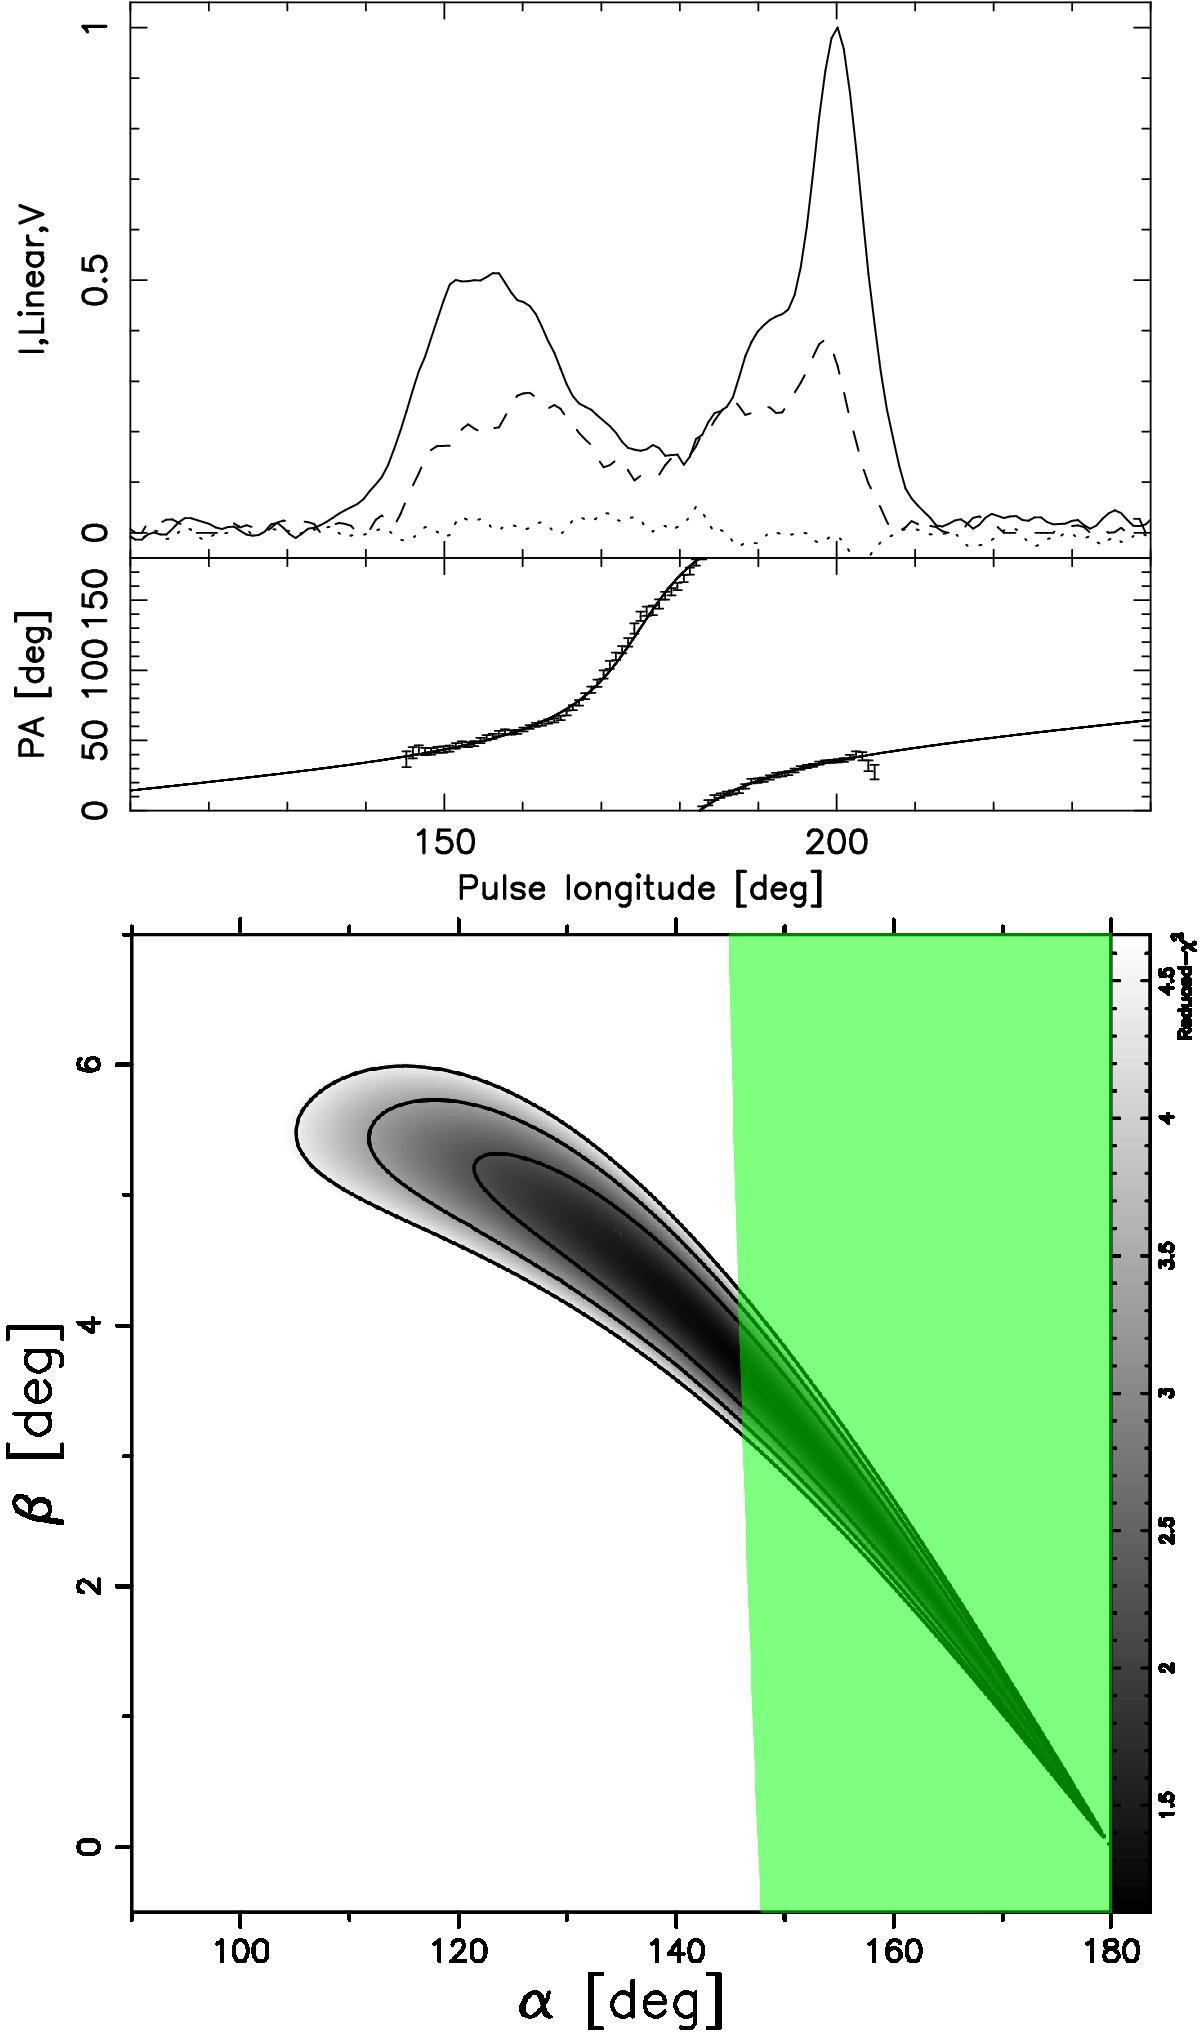
Top panel: polarimetric pulse profile of PSR B1839−04 observed at 1408 MHz (Gould & Lyne 1998) showing total intensity (solid line), linear polarization (dashed line) and circular polarization (dotted line). Below the profile the PA measurements are shown with the solid curve showing the best fit of the RVM. Lower panel: the goodness-of-fit of the RVM is shown in grey-scale, with the contours corresponding to 1, 2, and 3σ levels. For the green area of the graph the observed pulse width is consistent with considerations of the expected beam size for this pulsar (see main text).
Current usage metrics show cumulative count of Article Views (full-text article views including HTML views, PDF and ePub downloads, according to the available data) and Abstracts Views on Vision4Press platform.
Data correspond to usage on the plateform after 2015. The current usage metrics is available 48-96 hours after online publication and is updated daily on week days.
Initial download of the metrics may take a while.