Fig. 6
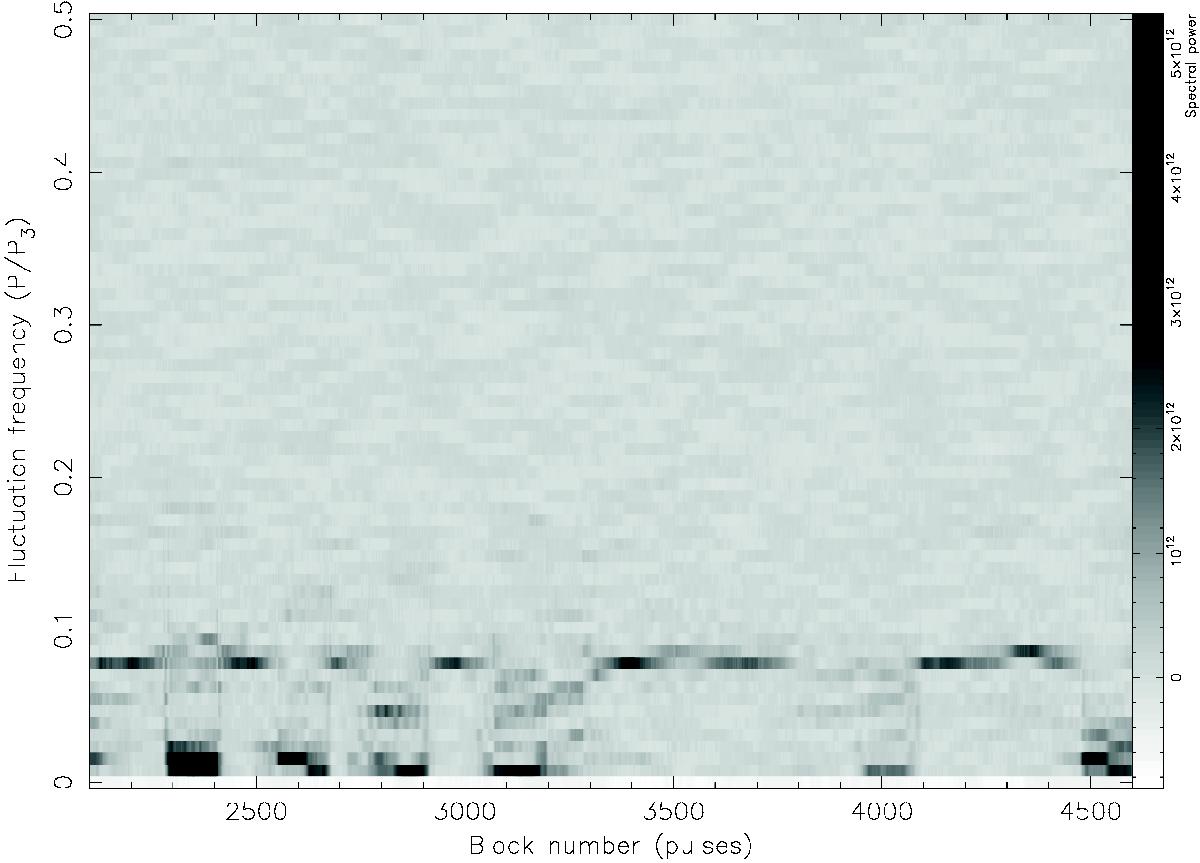
Part of the S2DFS of observation 2005a of PSR B1839−04, showing spectral power as a function of pattern repetition frequency in component II and time (defined as the start pulse number of the 128 pulses long sequence of pulses used to determine the spectral power). Transitions from the Q mode, during which there is a strong P/P3 = 0.08 spectral feature, to the B mode, during which low-frequency modulation dominates, are evident.
Current usage metrics show cumulative count of Article Views (full-text article views including HTML views, PDF and ePub downloads, according to the available data) and Abstracts Views on Vision4Press platform.
Data correspond to usage on the plateform after 2015. The current usage metrics is available 48-96 hours after online publication and is updated daily on week days.
Initial download of the metrics may take a while.