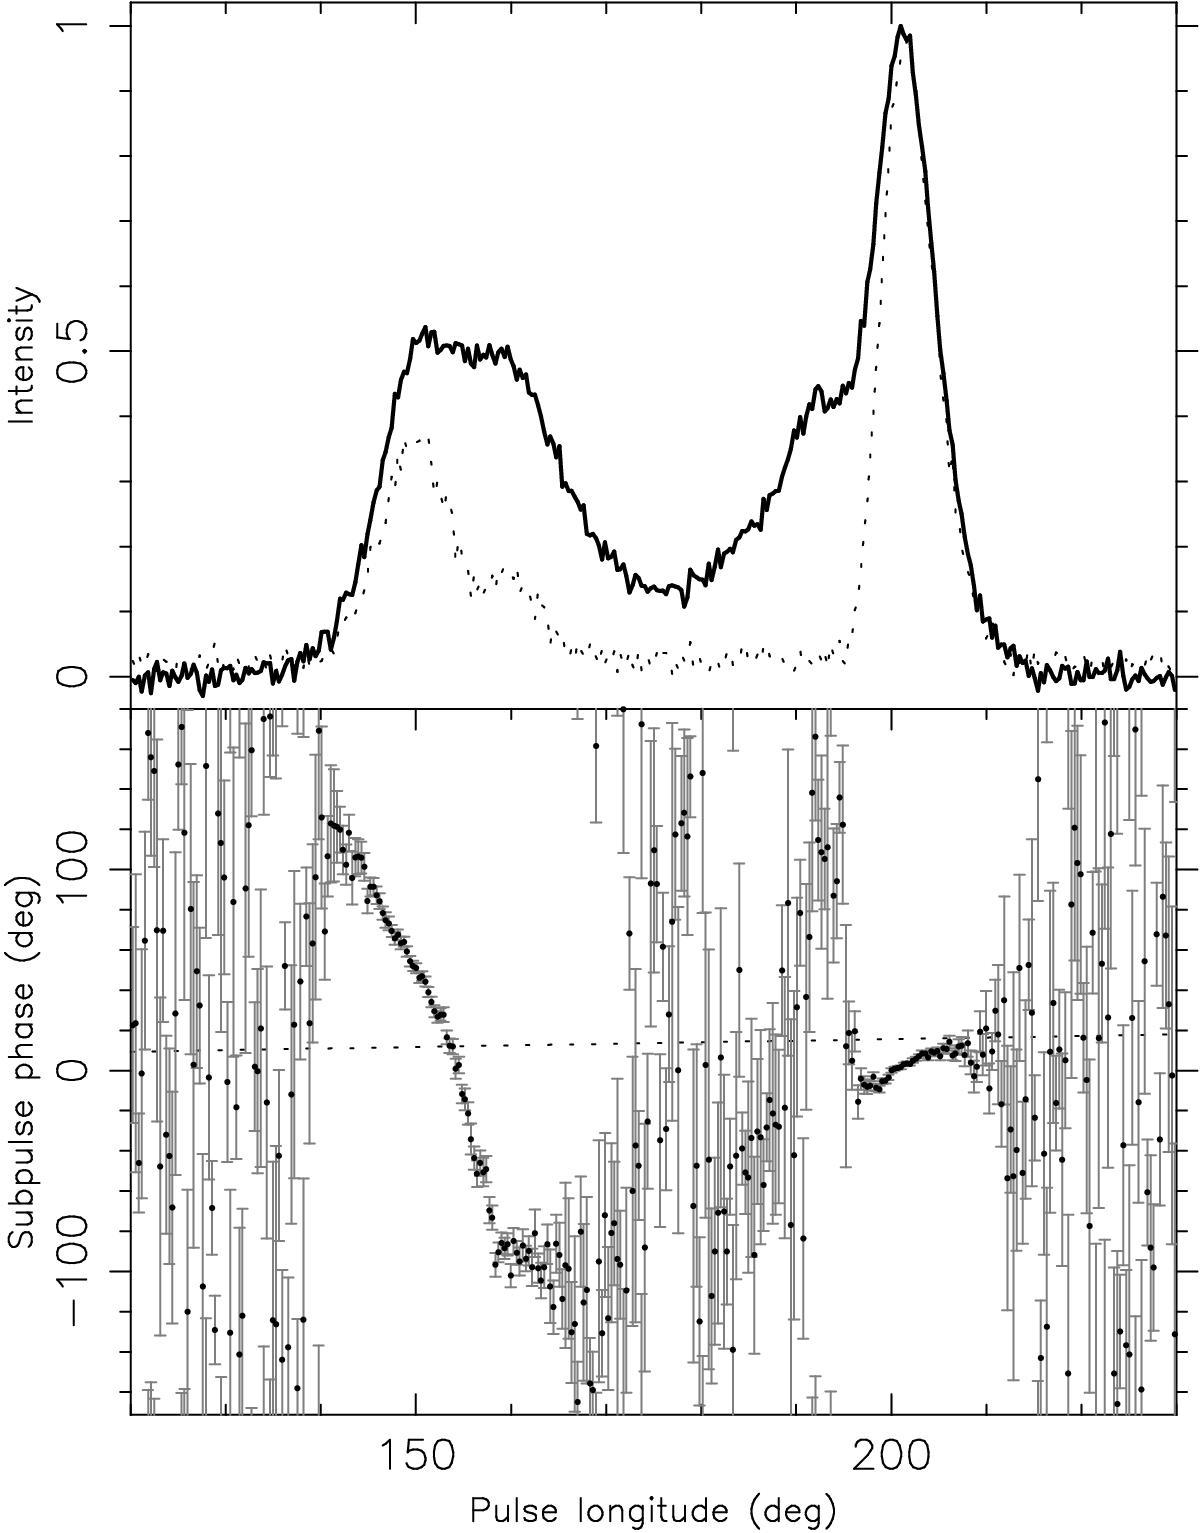
Fig. 5

Combined 2005 Q-mode data rebinned with a factor of 2. Upper panel: the strength of the 12P modulation pattern as a function of pulse longitude (dotted curve) and the pulse profile (black curve). Lower panel: the corresponding subpulse phase. An arbitrary phase offset has been applied to make the subpulse phase zero at the peak of the profile. The dotted line indicates the gradient of the phase relation expected for a modulation pattern that is longitude stationary in the co-rotating pulsar frame.
Current usage metrics show cumulative count of Article Views (full-text article views including HTML views, PDF and ePub downloads, according to the available data) and Abstracts Views on Vision4Press platform.
Data correspond to usage on the plateform after 2015. The current usage metrics is available 48-96 hours after online publication and is updated daily on week days.
Initial download of the metrics may take a while.


