Fig. 4
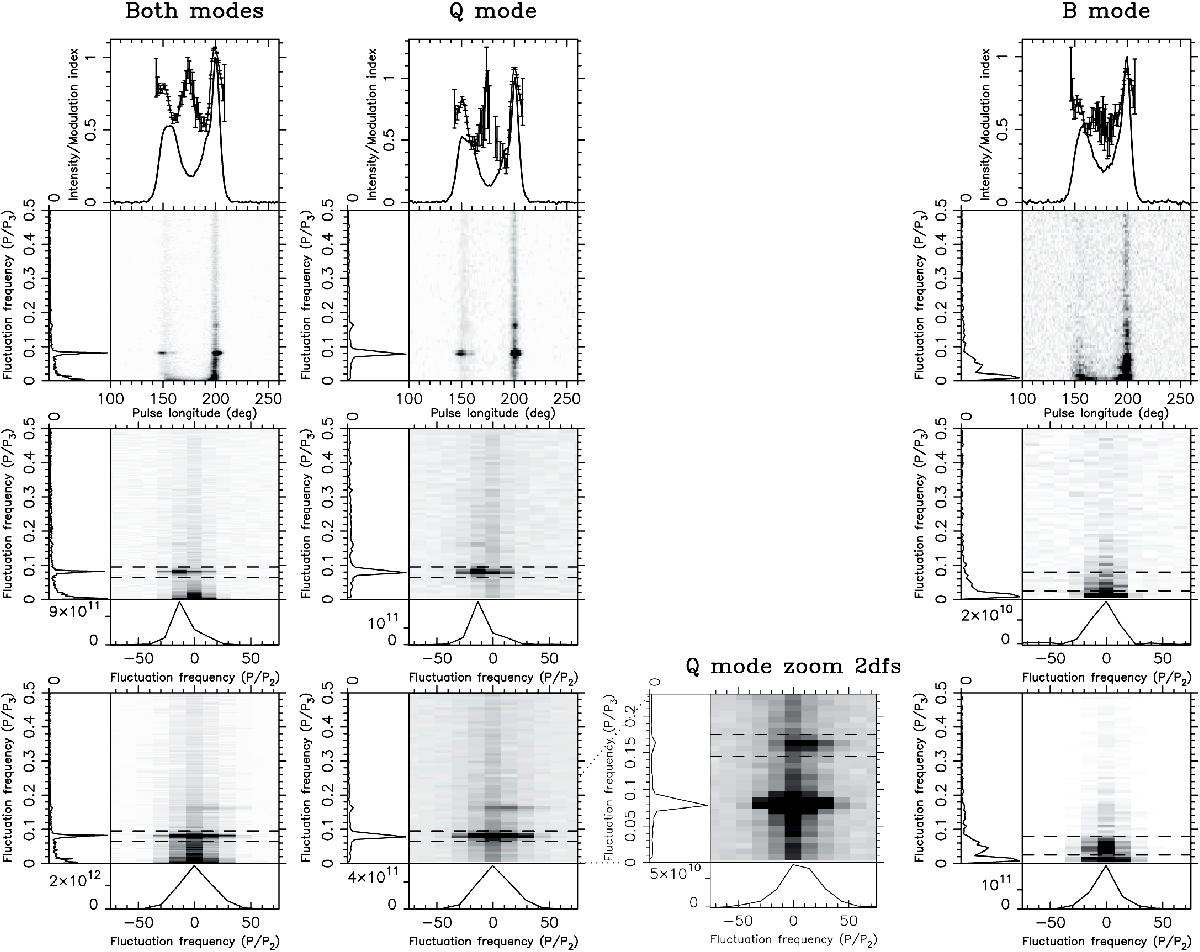
Fluctuation analysis of the emission including both modes of PSR B1839−04, and those of the Q and B mode separately. These are the combined 2005 data sets, rebinned with a factor 9 in pulse longitude. Top row: the pulse profile and the modulation index (points with error bars). Second row: the LRFS and a side panel showing the horizontally integrated power. Third row: the 2DFS of component I and side panels showing the horizontally (left) and vertically, between the dashed lines, integrated power (bottom). Bottom row: the 2DFS of component II. Third column: the 2DFS of Q-mode emission of component II with an adjusted vertical range and grey-scale emphasizing the second harmonic.
Current usage metrics show cumulative count of Article Views (full-text article views including HTML views, PDF and ePub downloads, according to the available data) and Abstracts Views on Vision4Press platform.
Data correspond to usage on the plateform after 2015. The current usage metrics is available 48-96 hours after online publication and is updated daily on week days.
Initial download of the metrics may take a while.