Fig. 2
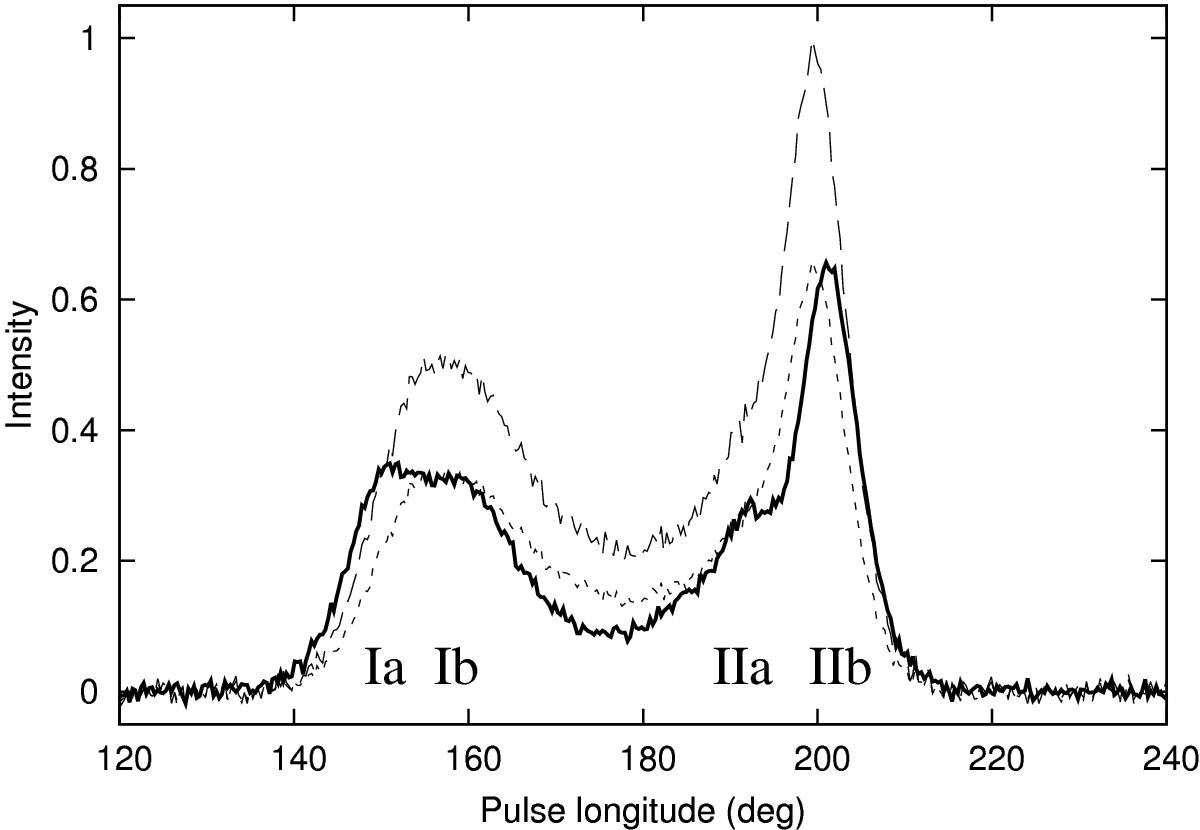
Pulse profile of the different modes of PSR B1839−04. These are the combined 2005 data sets (the Q- and B-mode profiles consist of 7605 and 3188 individual pulses, respectively), rebinned with a factor two. The thick solid line and the long-dashed profile show the Q- and B-mode profiles, respectively. The peak flux of the B-mode profile is normalised and the Q-mode profile is scaled accordingly after taking into account the difference in number of pulses. The dotted profile is a scaled-down B-mode profile to aid a comparison between the shapes of the profiles in the two modes. The location of the four profile components are labelled.
Current usage metrics show cumulative count of Article Views (full-text article views including HTML views, PDF and ePub downloads, according to the available data) and Abstracts Views on Vision4Press platform.
Data correspond to usage on the plateform after 2015. The current usage metrics is available 48-96 hours after online publication and is updated daily on week days.
Initial download of the metrics may take a while.