Fig. 1
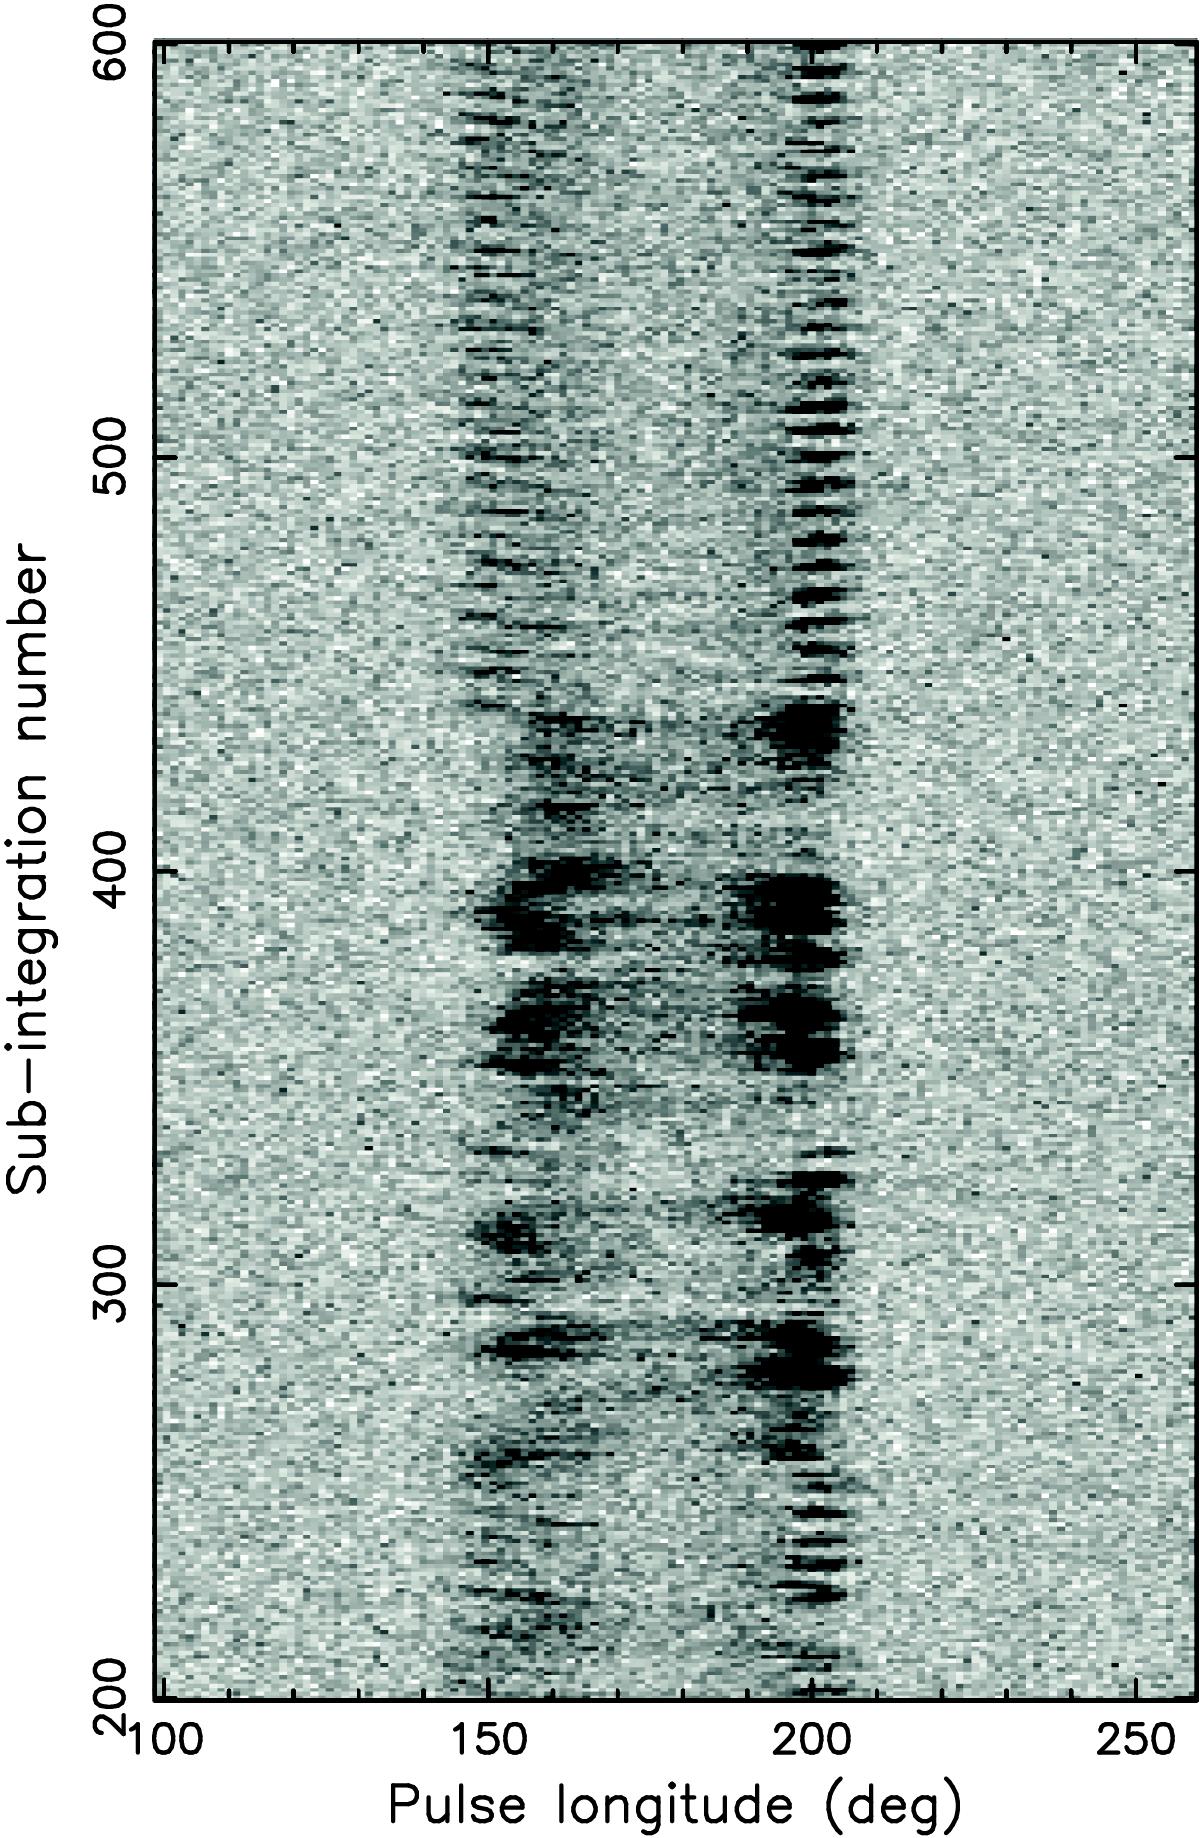
Pulse stack of PSR B1839−04. This is data set 2005a, rebinned into 300 pulse longitude bins. Every two pulses are summed together, so each subintegration contains the signal of two rotational periods. The data are clipped, meaning that all intensities above a certain threshold are set to that threshold value, thereby restricting the dynamic range. This makes the weaker features better visible.
Current usage metrics show cumulative count of Article Views (full-text article views including HTML views, PDF and ePub downloads, according to the available data) and Abstracts Views on Vision4Press platform.
Data correspond to usage on the plateform after 2015. The current usage metrics is available 48-96 hours after online publication and is updated daily on week days.
Initial download of the metrics may take a while.