Fig. 8
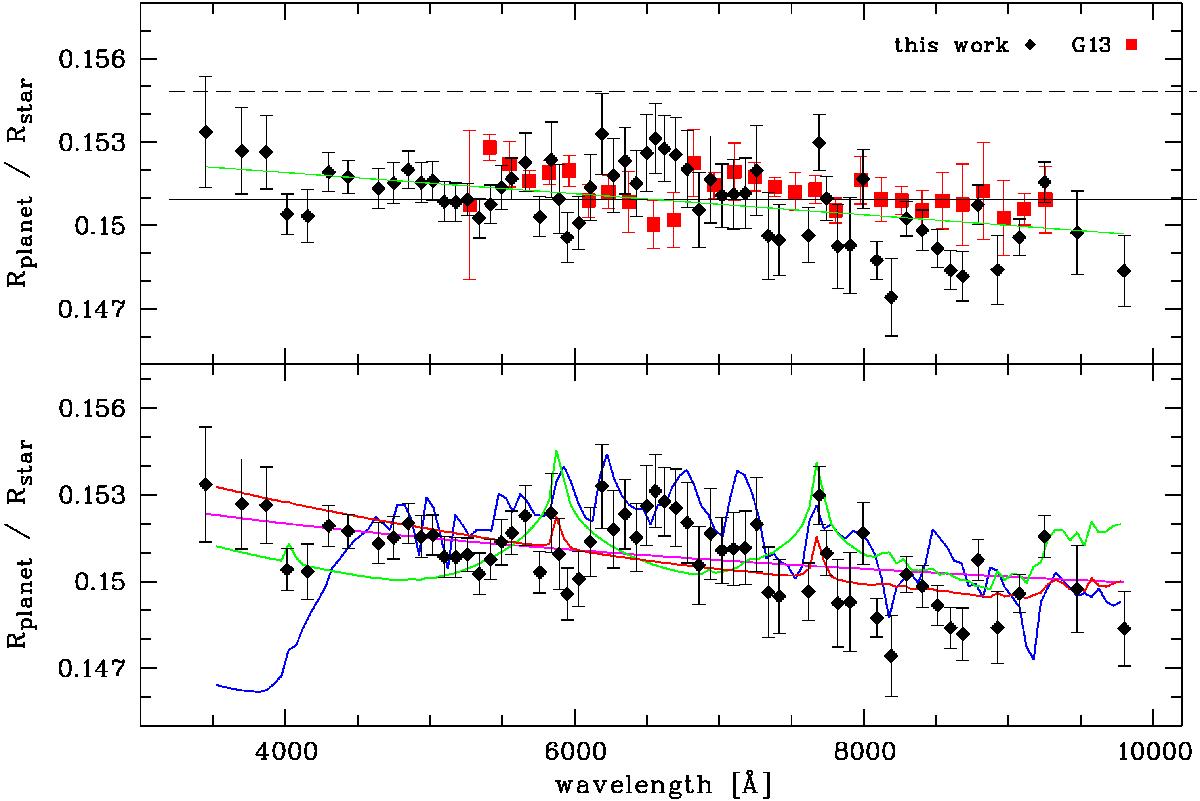
Transmission spectrum of HAT-P-32b derived from the MODS transit measurement. Upper panel: the transmission spectrum of this work (black) is compared to the derived spectrum of G13 (red). Overplotted in green is the best fit of a linear function over wavelength. The horizontal dashed lines indicate three pressure scale heights of the planetary atmosphere. Lower panel: our spectrum is overplotted with a cloud-free solar-composition model of 1750 K (blue line), a cloud-free solar composition model of 1750 K without TiO (green line), a solar composition model of 1750 K including H2 Rayleigh scattering increased by a factor of 100 (red line), and a best-fit Rayleigh scattering slope of 890 K (magenta line).
Current usage metrics show cumulative count of Article Views (full-text article views including HTML views, PDF and ePub downloads, according to the available data) and Abstracts Views on Vision4Press platform.
Data correspond to usage on the plateform after 2015. The current usage metrics is available 48-96 hours after online publication and is updated daily on week days.
Initial download of the metrics may take a while.