Free Access
Fig. 7
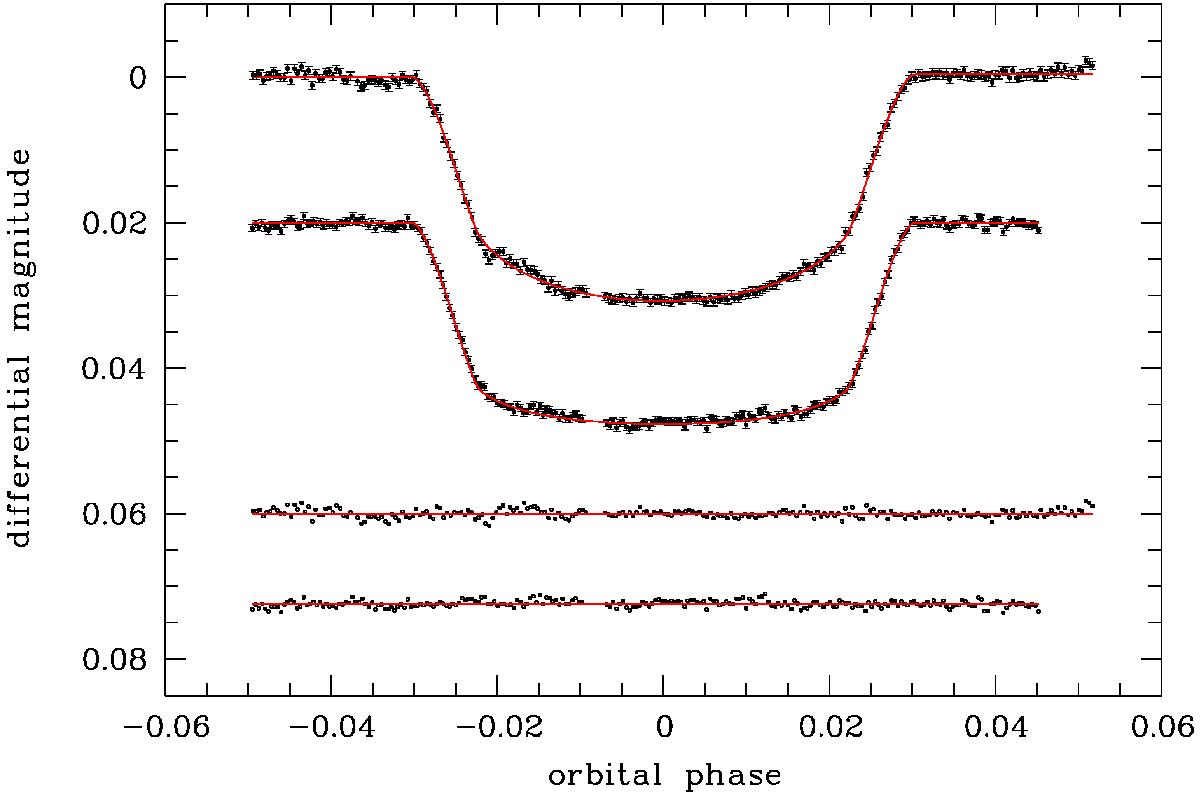
Averaged light curves for the blue and the red arm, and their corresponding residuals (from top to bottom). Overplotted in red are the best-fit transit models including a linear (blue arm) and a quadratic (red arm) detrending function over time.
Current usage metrics show cumulative count of Article Views (full-text article views including HTML views, PDF and ePub downloads, according to the available data) and Abstracts Views on Vision4Press platform.
Data correspond to usage on the plateform after 2015. The current usage metrics is available 48-96 hours after online publication and is updated daily on week days.
Initial download of the metrics may take a while.