Free Access
Fig. 3
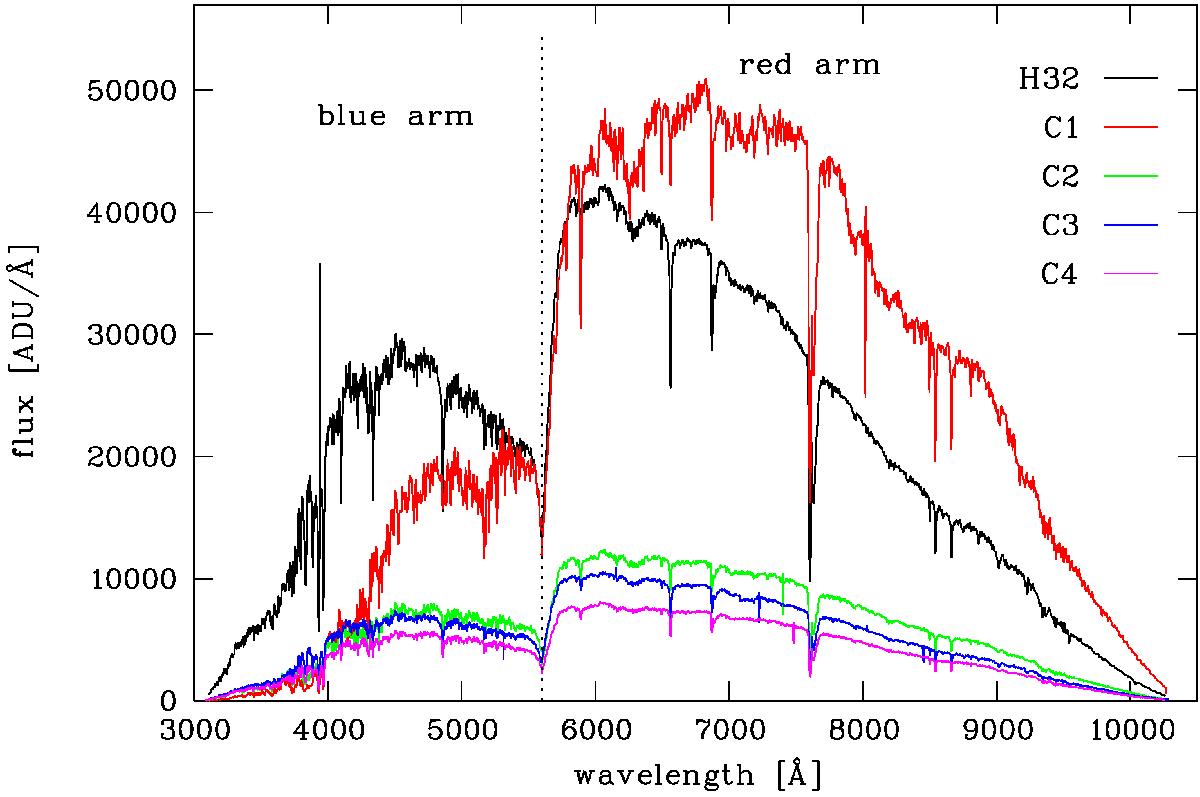
Example spectra of a single exposure of HAT-P-32 and the four comparison stars. The wavelength separation of the blue and the red arm of MODS at 5600 Å is indicated by a vertical dotted line. The features at ~3940 Å in the spectrum of HAT-P-32 (black) and at ~8011 Å in the spectrum of C1 (red) are caused by CCD errors.
Current usage metrics show cumulative count of Article Views (full-text article views including HTML views, PDF and ePub downloads, according to the available data) and Abstracts Views on Vision4Press platform.
Data correspond to usage on the plateform after 2015. The current usage metrics is available 48-96 hours after online publication and is updated daily on week days.
Initial download of the metrics may take a while.