Fig. 2
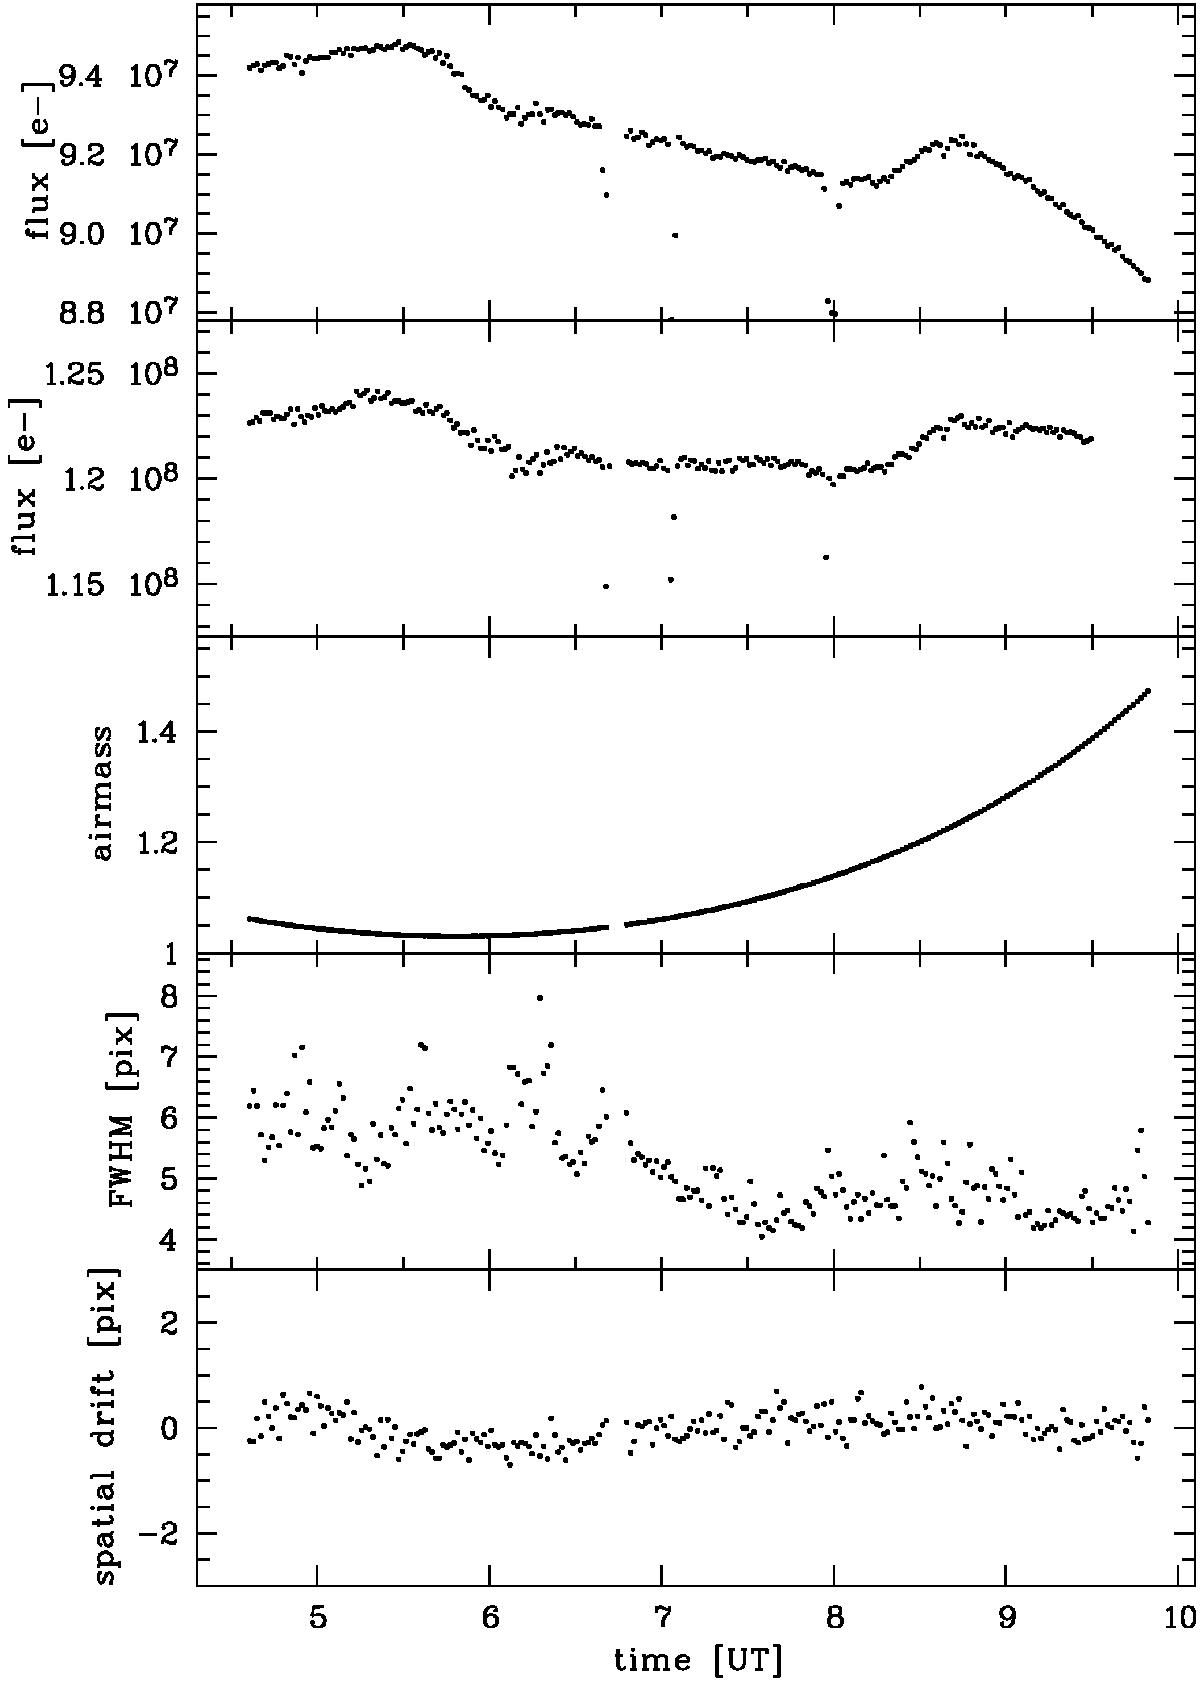
Evolution of observational parameters over the time series. From top to bottom: the count rate of HAT-P-32 of the blue light curve and the red light curve, the airmass, the full width at half maximum (FWHM) of the spectral profile in spatial direction, and the drift of the centroid of the spectral profile in spatial direction.
Current usage metrics show cumulative count of Article Views (full-text article views including HTML views, PDF and ePub downloads, according to the available data) and Abstracts Views on Vision4Press platform.
Data correspond to usage on the plateform after 2015. The current usage metrics is available 48-96 hours after online publication and is updated daily on week days.
Initial download of the metrics may take a while.