Fig. 6
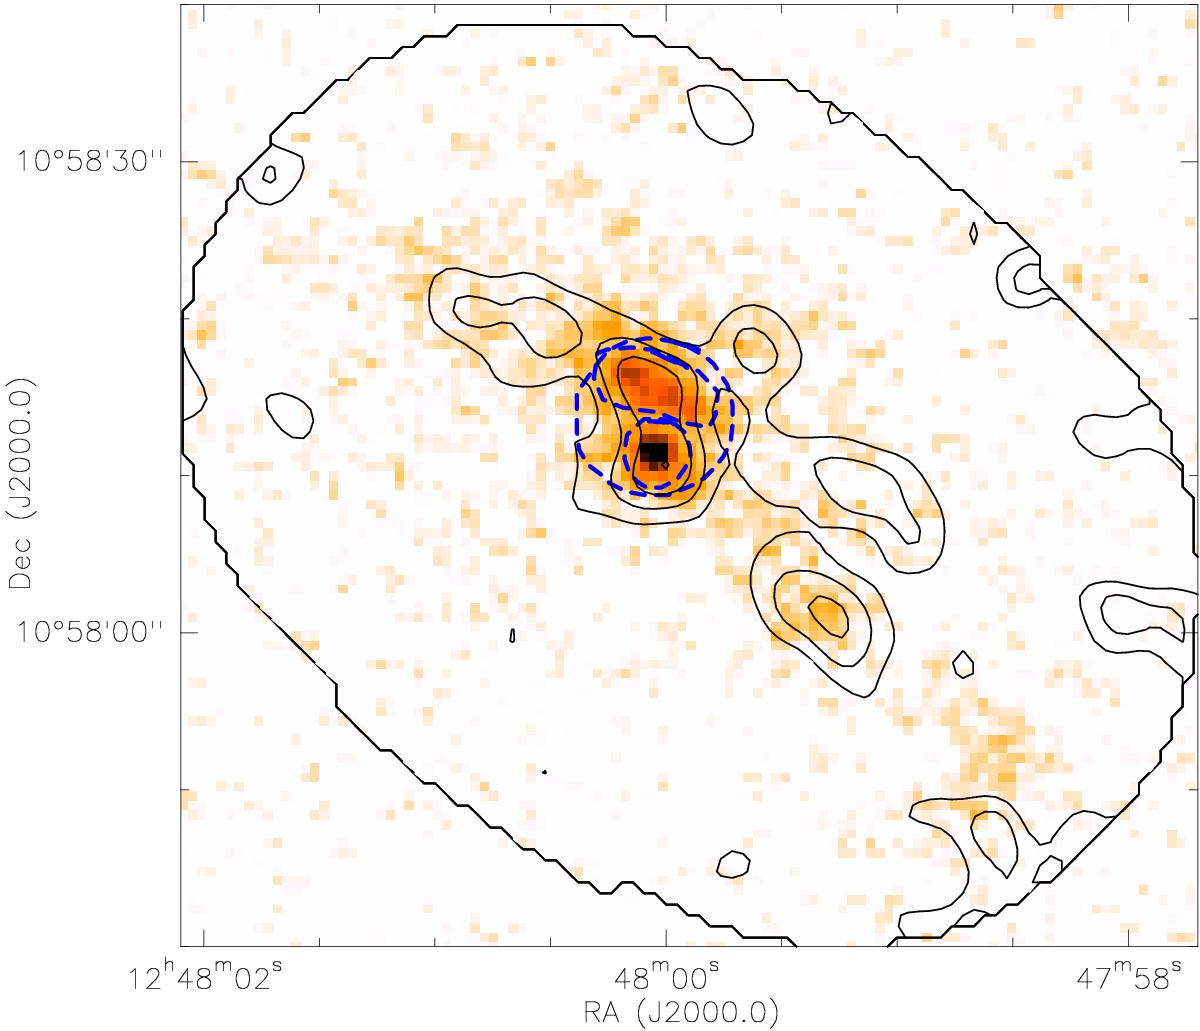
Overlay of IRAC 8 μm data (colour) and CO contours (black contours), starting at 0.15 Jy km s-1 beam-1 (~3σ) and incrementing in steps of 0.1 Jy km s-1 beam-1. The blue dashed contours show the apertures used for the measurement of the SFR and molecular gas. The outer black line shows the Field of View of the PdBI observations.
Current usage metrics show cumulative count of Article Views (full-text article views including HTML views, PDF and ePub downloads, according to the available data) and Abstracts Views on Vision4Press platform.
Data correspond to usage on the plateform after 2015. The current usage metrics is available 48-96 hours after online publication and is updated daily on week days.
Initial download of the metrics may take a while.