Fig. 10
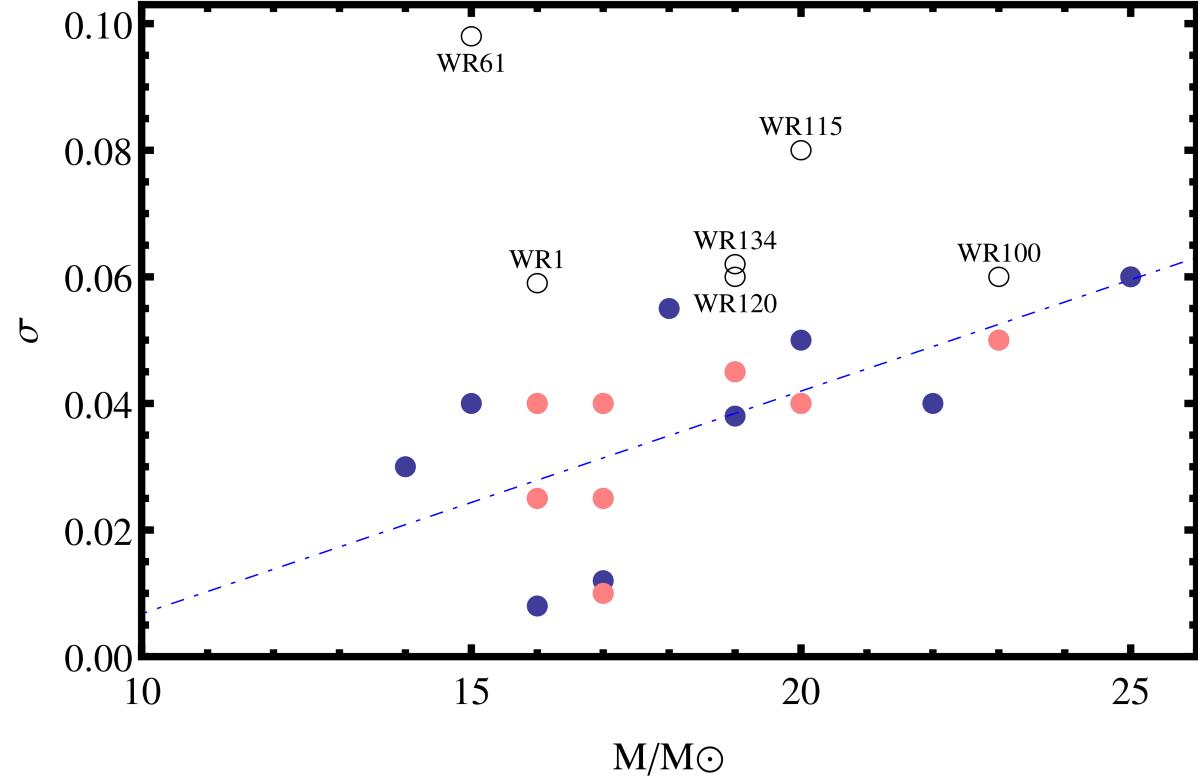
Variability of rms relative to the line strength σ as a function of mass of the Galactic H-free WN stars. The blue dots correspond to the small-scale variability in WN stars from St-Louis et al. (2009), Chené & St-Louis (2011), Michaux et al. (2014), while the pink dots correspond to the variability for the stars analysed in this work (see Appendix A). Empty black circles correspond to CIR-type variability (St-Louis et al. 2009; Chené & St-Louis 2011; St-Louis 2013). The stellar masses are derived by Hamann et al. (2006). The linear fit in blue dashed is computed considering only the blue and pink dots. The Spearman’s rank correlation coefficient is ≈0.7.
Current usage metrics show cumulative count of Article Views (full-text article views including HTML views, PDF and ePub downloads, according to the available data) and Abstracts Views on Vision4Press platform.
Data correspond to usage on the plateform after 2015. The current usage metrics is available 48-96 hours after online publication and is updated daily on week days.
Initial download of the metrics may take a while.