Free Access
Fig. 5
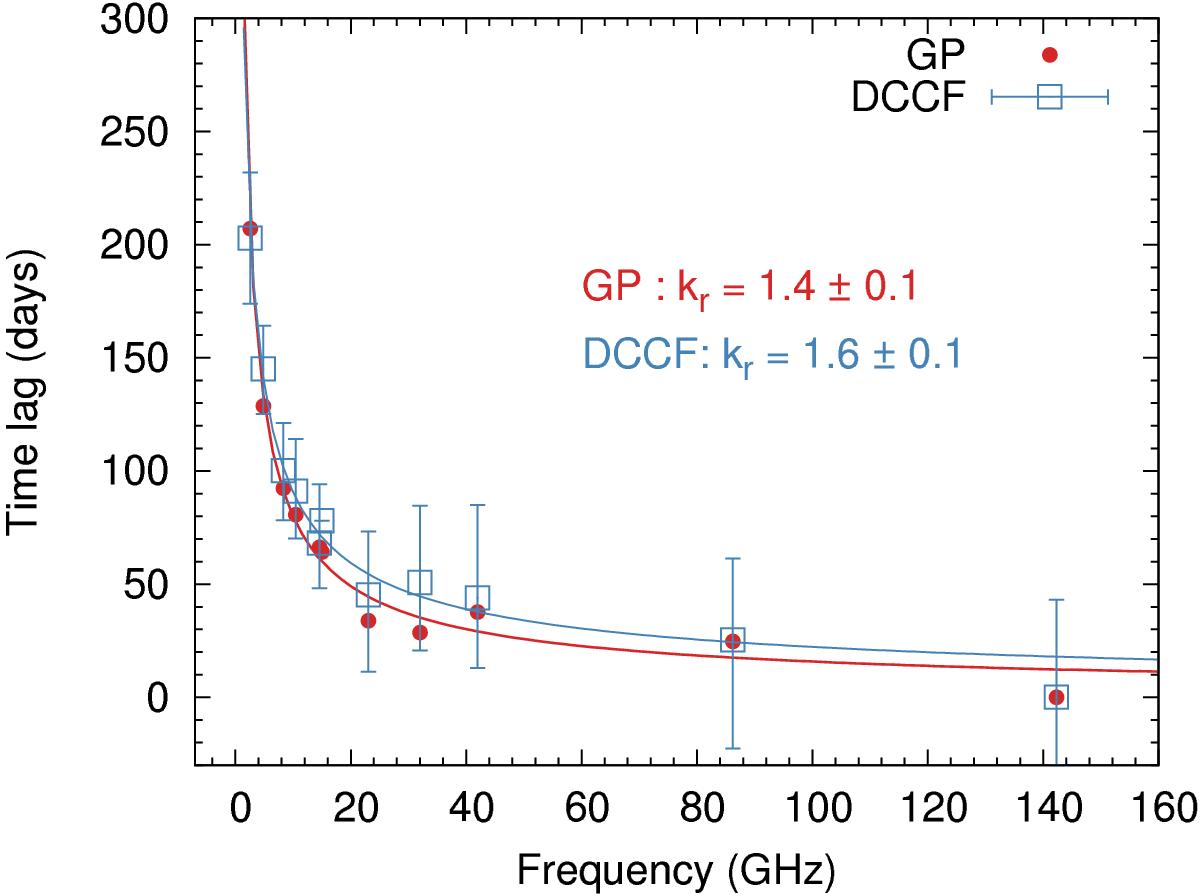
Frequency dependence of the time lags with respect to the data at 142.33 GHz. Red circles denote values resulting from the GP regression and blue squares those from the DCCF analysis. Solid lines represent the best-fit power laws.
Current usage metrics show cumulative count of Article Views (full-text article views including HTML views, PDF and ePub downloads, according to the available data) and Abstracts Views on Vision4Press platform.
Data correspond to usage on the plateform after 2015. The current usage metrics is available 48-96 hours after online publication and is updated daily on week days.
Initial download of the metrics may take a while.