Free Access
Fig. 1
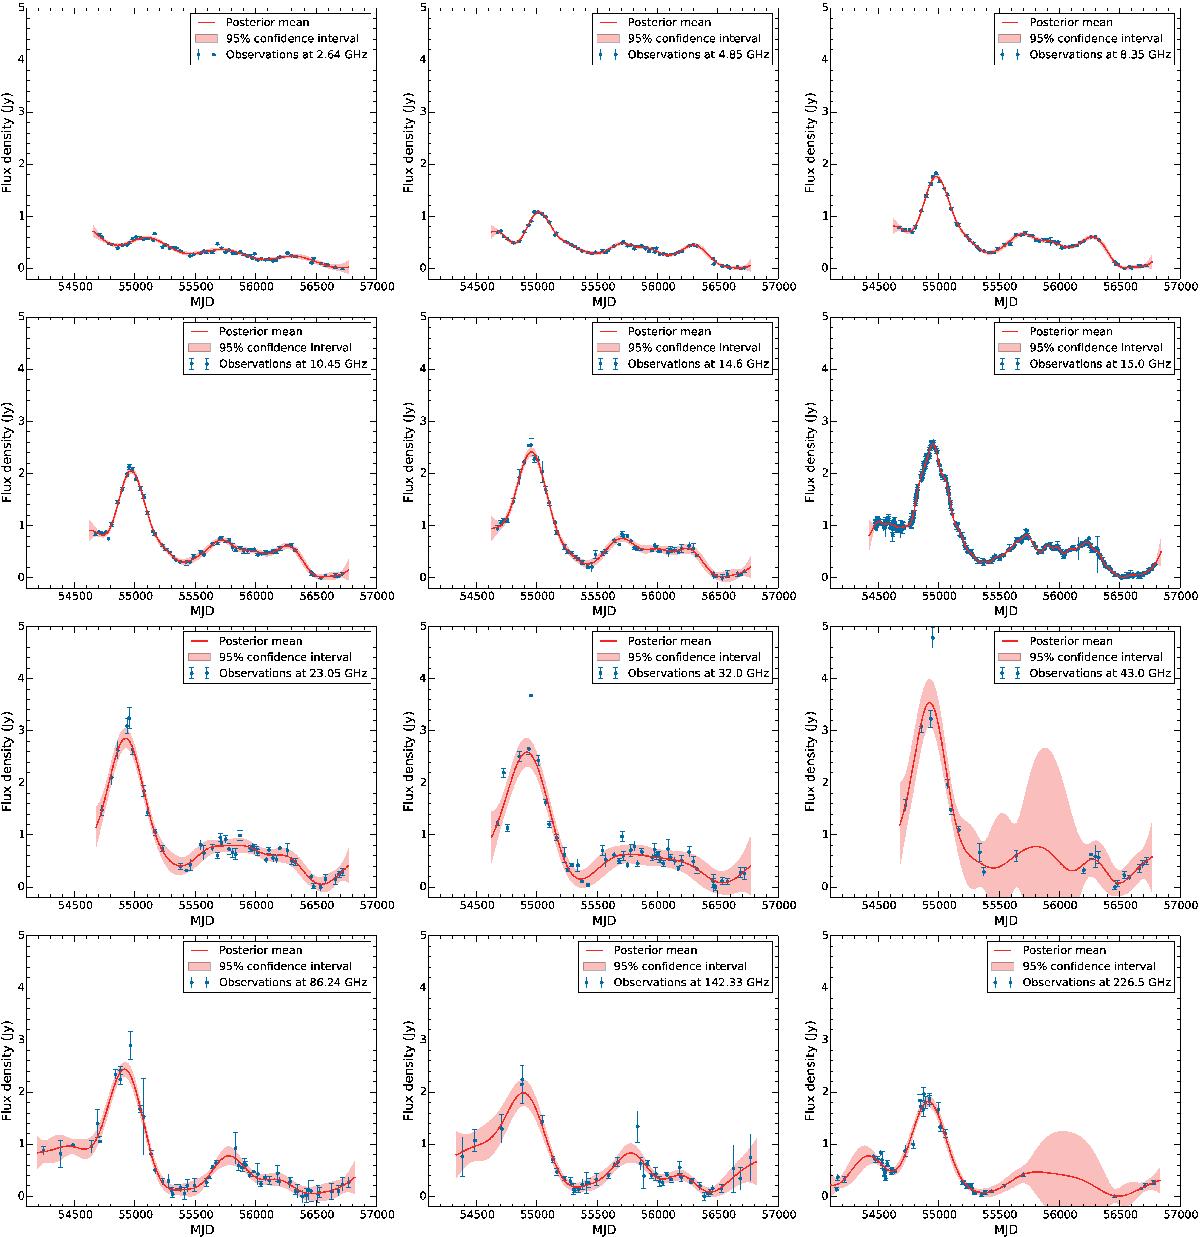
Gaussian process regression curves for the radio light curves in the range 2.64–226.50 GHz, shown here with the minimum flux density, S0, subtracted. Observations are shown in blue, the posterior mean (prediction curve) in red, and the 95% confidence interval is the lighter red-shaded area.
Current usage metrics show cumulative count of Article Views (full-text article views including HTML views, PDF and ePub downloads, according to the available data) and Abstracts Views on Vision4Press platform.
Data correspond to usage on the plateform after 2015. The current usage metrics is available 48-96 hours after online publication and is updated daily on week days.
Initial download of the metrics may take a while.