Fig. 5
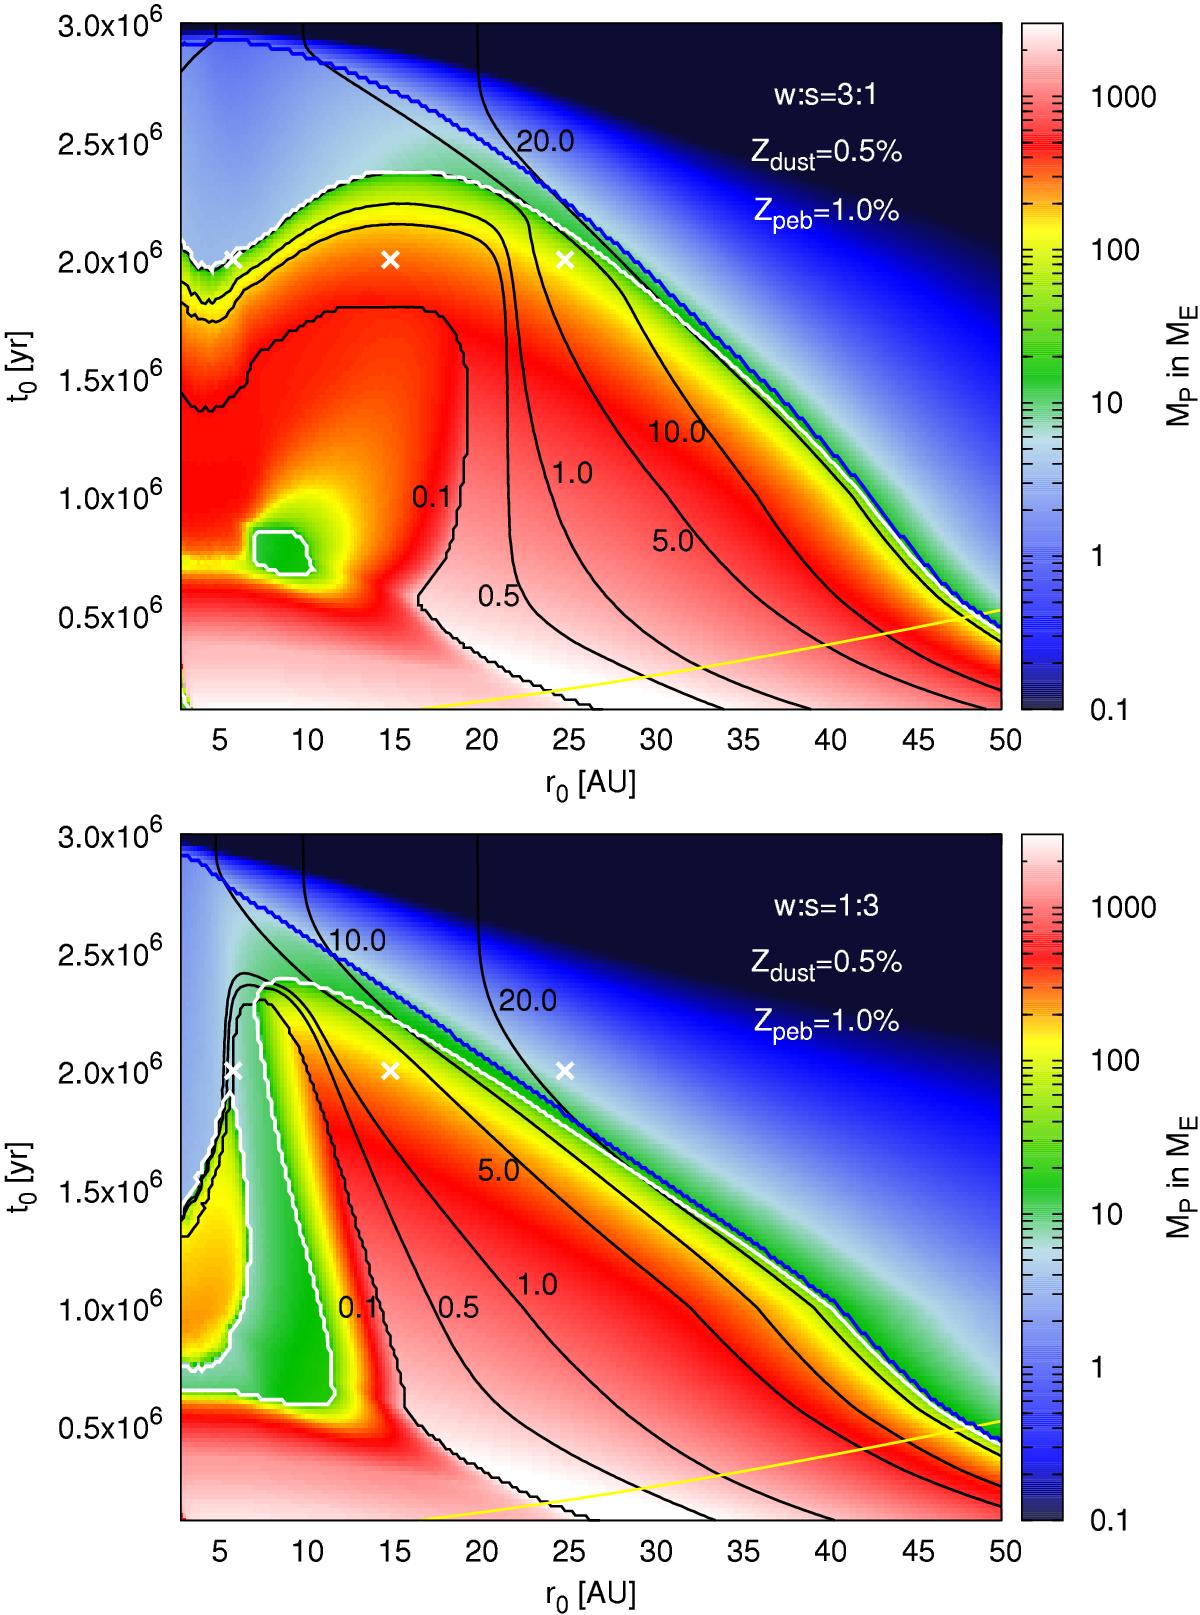
Final masses of planets (MP = Mc + Menv) as a function of initial radius r0 and initial time t0 in discs with a dust metallicity of Zdust = 0.5%. The top plot features an water-to-silicate ratio of 3:1, while the bottom plot features a water-to-silicate ratio of 1:3. Planets that are below the dark blue line have reached pebble isolation mass and can accrete gas. All planets that are inside the white lines have Mc<Menv, indicating that they have underwent runaway gas accretion. The yellow line marks the pebble production line; planets below the yellow line can not have formed by pebble accretion, because the pebbles have not yet formed at the insertion time of the planet, see Lambrechts & Johansen (2014). The black lines indicate the final orbital distance rf of the planet. The white crosses indicate r0 and t0 for the evolution tracks shown in Fig. 4.
Current usage metrics show cumulative count of Article Views (full-text article views including HTML views, PDF and ePub downloads, according to the available data) and Abstracts Views on Vision4Press platform.
Data correspond to usage on the plateform after 2015. The current usage metrics is available 48-96 hours after online publication and is updated daily on week days.
Initial download of the metrics may take a while.