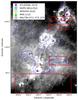
Fig. A.2

Top: grayscale GLIMPSE 8 μm image of the GMF 309.5-308.7. The blue contours show the 13CO integrated intensity of 1.5 K /km s-1 and 3 K /km s-1, integrated over the velocity range [–53, –35] km s-1. The red contours show the ATLASGAL emission at a contour level of F870 μm = 250 mJy/beam. The red boxes show regions with poor ThruMMS data or absence of it. The filled geometric objects show all the dense gas measurements from different surveys with vLSR within the velocity range indicated in Table 2. Symbols as in Fig. A.1. Middle: position-velocity diagram of the 13CO line of the GMF 309.5–308.7, obtained from a slice following the extinction feature used to identify GMF 309.5–308.7. Bottom: PV diagram of the 12CO emission between | b | ≤ 1°. The yellow line shows GMF 309.5–308.7 in the PV space. The green solid line shows the Scutum-Centaurus arm as predicted by Reid et al. (2014) and the dashed green lines show ±10 km s-1 of the velocity of the spiral arm.
Current usage metrics show cumulative count of Article Views (full-text article views including HTML views, PDF and ePub downloads, according to the available data) and Abstracts Views on Vision4Press platform.
Data correspond to usage on the plateform after 2015. The current usage metrics is available 48-96 hours after online publication and is updated daily on week days.
Initial download of the metrics may take a while.