Free Access
Fig. 4
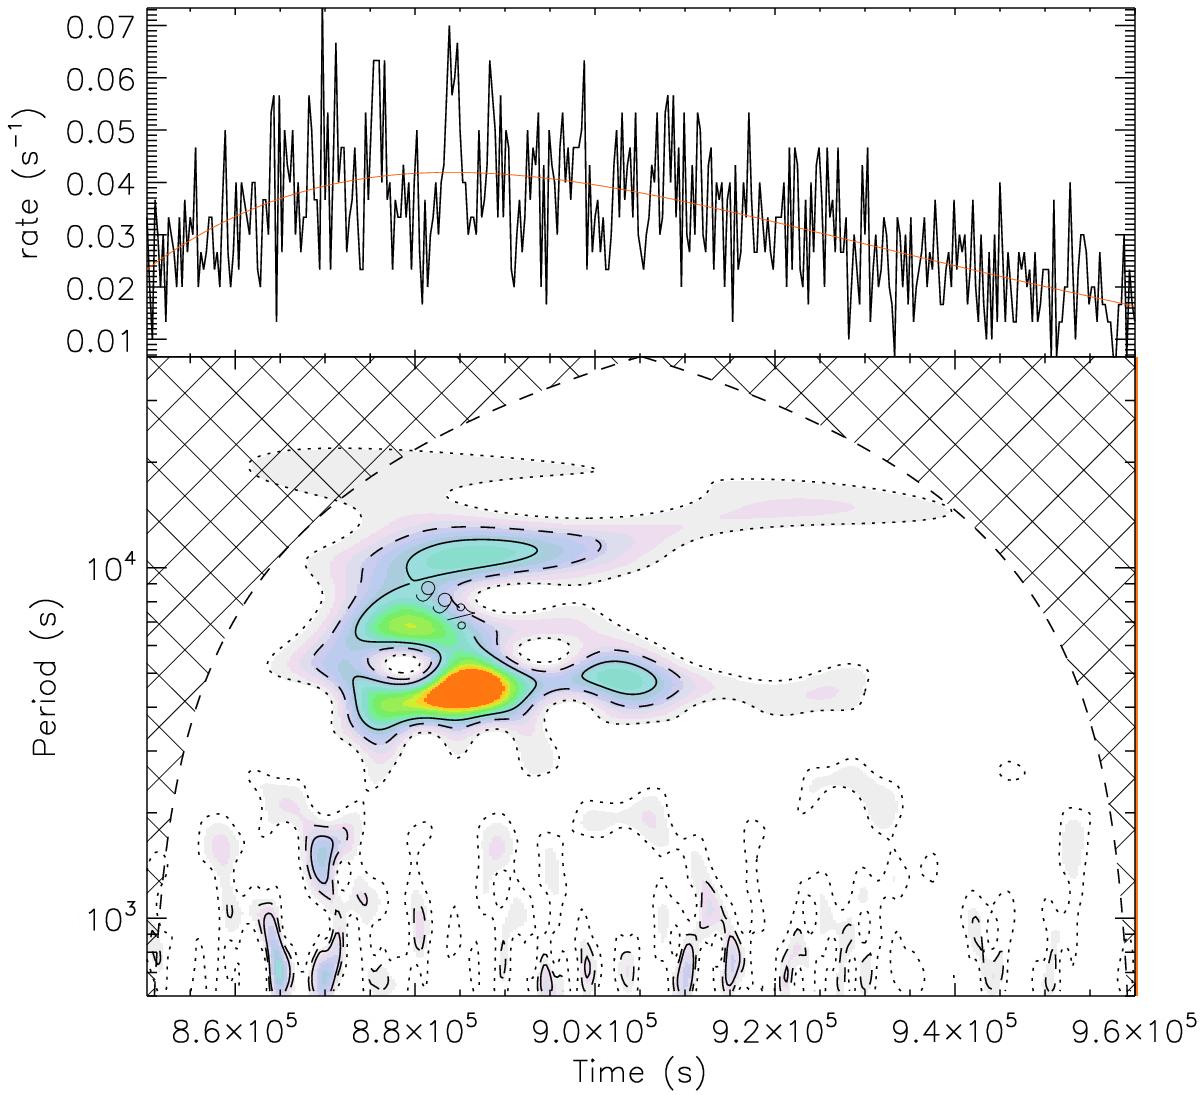
Wavelet power spectrum of a flare of source COUP 597 (V2252 Ori) in the bottom panel. Top panel shows the observed light curve in the time interval of the flare. Lines are as in Fig. 2. Time binning is 300 s.
Current usage metrics show cumulative count of Article Views (full-text article views including HTML views, PDF and ePub downloads, according to the available data) and Abstracts Views on Vision4Press platform.
Data correspond to usage on the plateform after 2015. The current usage metrics is available 48-96 hours after online publication and is updated daily on week days.
Initial download of the metrics may take a while.