Fig. 2
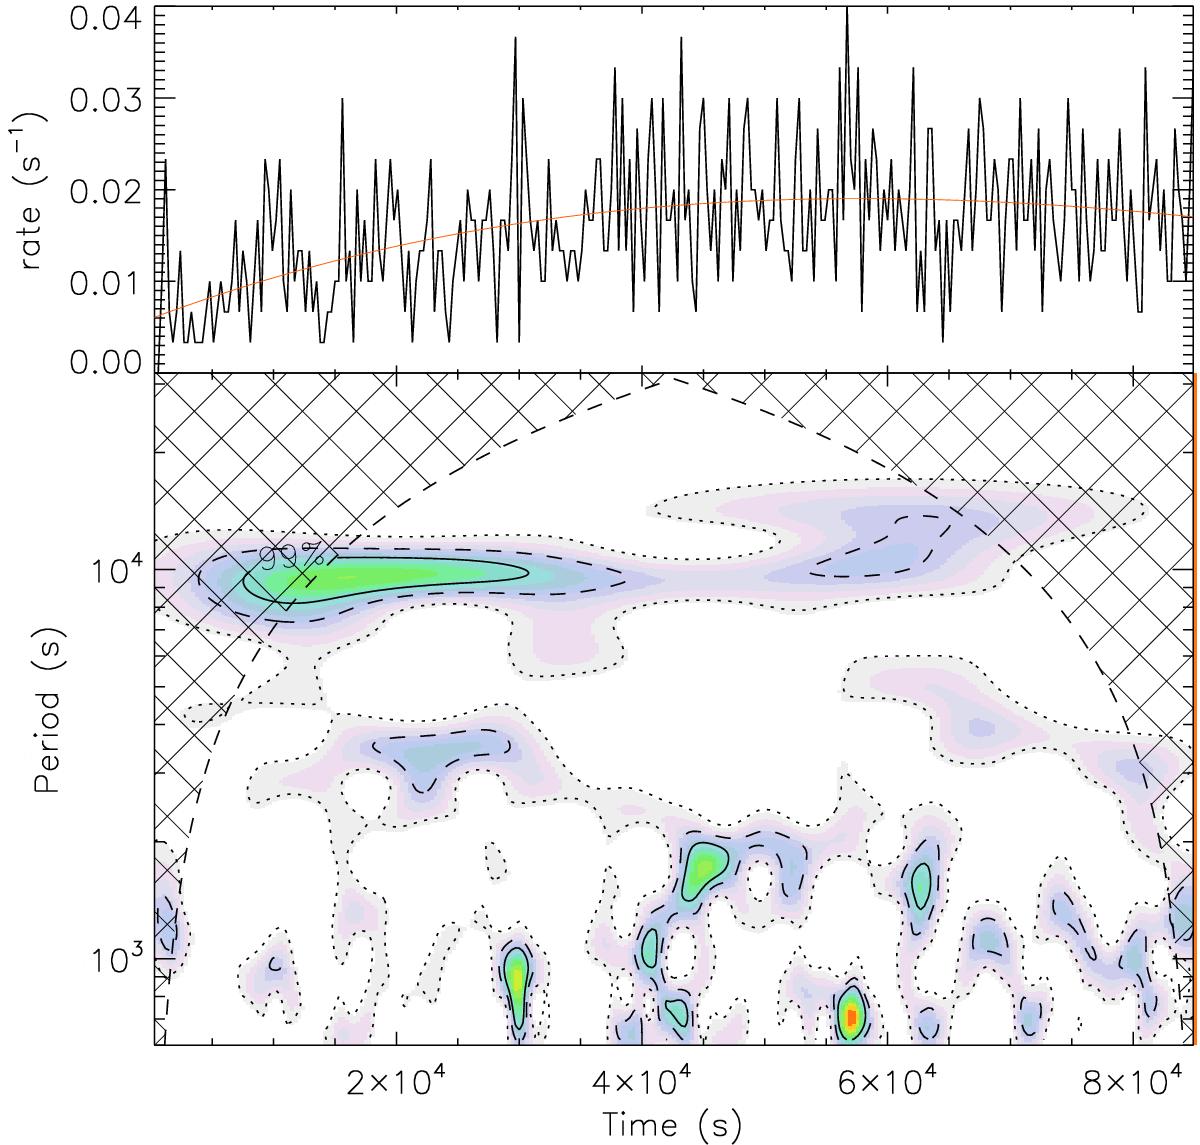
Wavelet power spectrum of a flare of source COUP 332 in the bottom panel. Contours are for confidence levels 67% (dotted line), 95% (dashed line), and 99% (continuous line). The hatched area is the cone of influence (COI), the region of the wavelet power spectrum in which edge effects become important (Torrence & Compo 1998). Top panel shows the observed light curve. Overplotted as a continuous line is the flare’s global shape. Time binning is 300 s.
Current usage metrics show cumulative count of Article Views (full-text article views including HTML views, PDF and ePub downloads, according to the available data) and Abstracts Views on Vision4Press platform.
Data correspond to usage on the plateform after 2015. The current usage metrics is available 48-96 hours after online publication and is updated daily on week days.
Initial download of the metrics may take a while.