Fig. 6
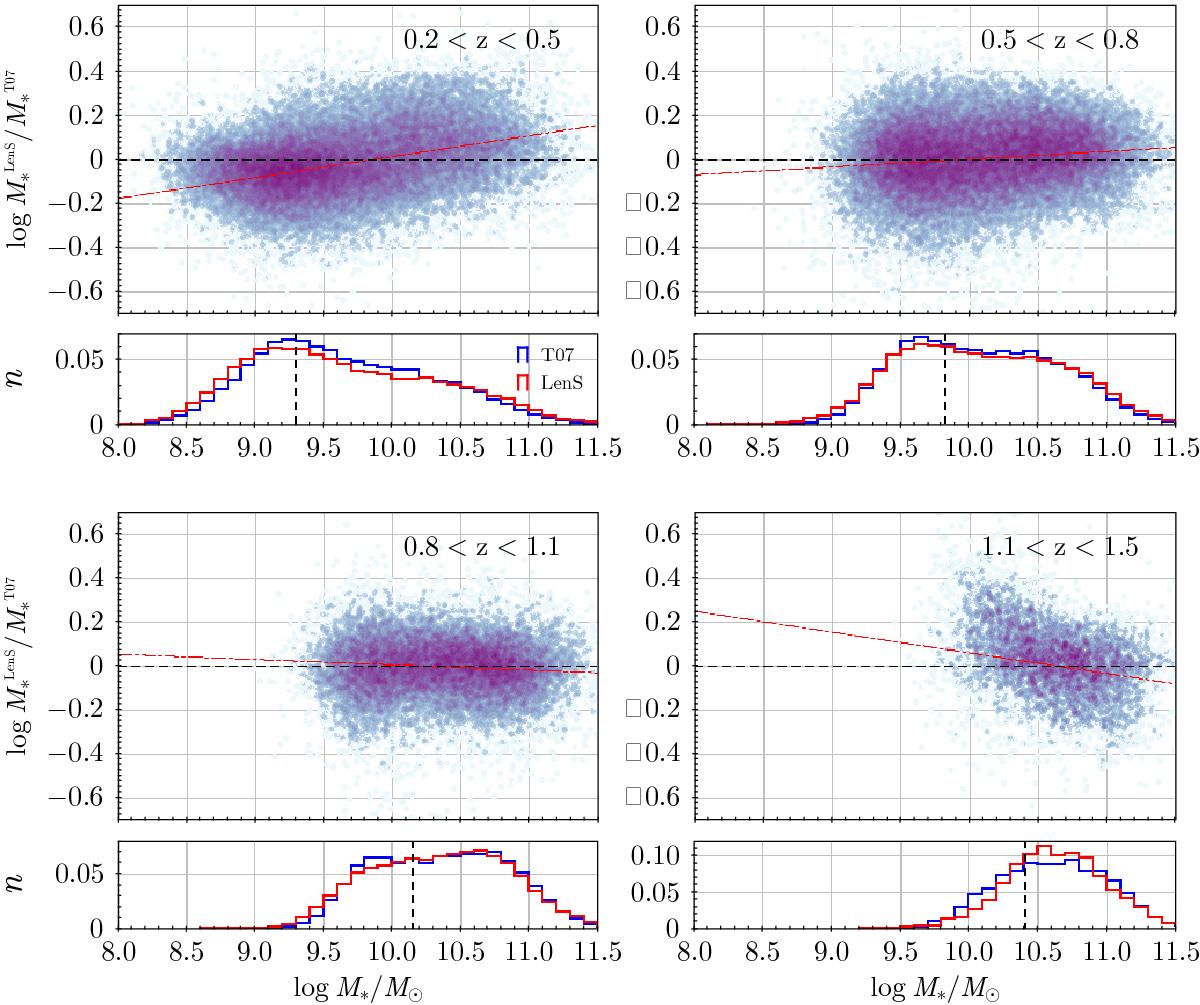
Differences between the stellar mass obtained with T0007 and CFHTLenS, ![]() and
and ![]() at different redshifts: the object-by-object
at different redshifts: the object-by-object ![]() ratio versus
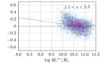
ratio versus ![]() in the upper panel, where the red dashed line is the linear regression, and the
in the upper panel, where the red dashed line is the linear regression, and the ![]() (blue) and
(blue) and ![]() (red) normalised number counts in the lower panel, where the vertical black dashed line represents the mass completeness limit.
(red) normalised number counts in the lower panel, where the vertical black dashed line represents the mass completeness limit.
Current usage metrics show cumulative count of Article Views (full-text article views including HTML views, PDF and ePub downloads, according to the available data) and Abstracts Views on Vision4Press platform.
Data correspond to usage on the plateform after 2015. The current usage metrics is available 48-96 hours after online publication and is updated daily on week days.
Initial download of the metrics may take a while.