Fig. 20
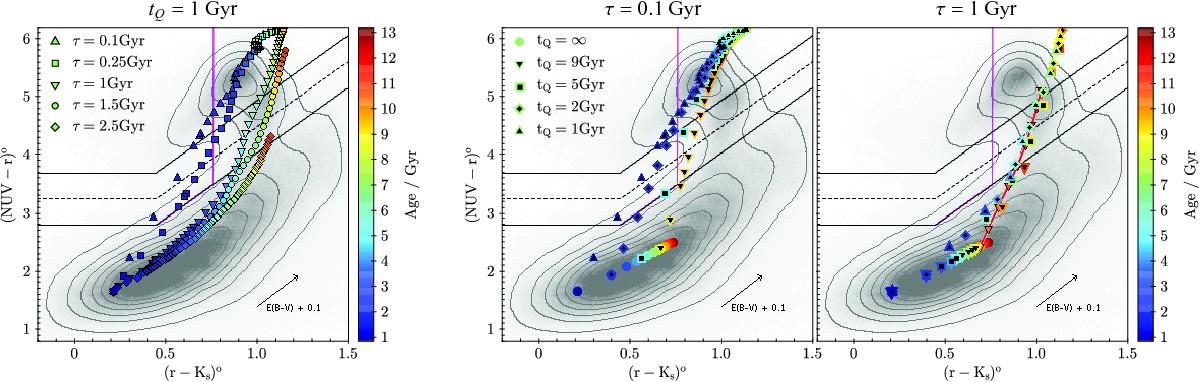
Predicted BC03 tracks in the NUVrK diagram at 0.2 <z< 0.5 for Z = 0.008 (Calzetti et al. 2000) and E(B−V) = 0.2. The arrow shows the shift expected for E(B−V) + 0.1. Analogously to Fig. 8, the black solid and dashed lines correspond to the limits of the green valley and its middle, respectively, while we report the (r−Ks)°-limit of the ℳ⋆-quenching channel with a vertical magenta solid line. The grey contours outline the galaxy density distribution. Each marker is coloured with respect to the corresponding stellar age (in Gyr). Left panel: only one quenching time is considered: tQ = 1 Gyr, with τ = 0.1 Gyr (triangles), τ = 0.25 Gyr (squares), τ = 1 Gyr (inverted triangles), τ = 1.5 Gyr (circles), and τ = 2.5 Gyr (diamonds). Right panels: two quenching timescales are considered: τ = 0.1 Gyr (middle panel) and τ = 1 Gyr (right panel), for tQ = 1 Gyr (triangles), 2 Gyr (diamonds), 5 Gyr (squares), and 9 Gyr (inverted triangles). The filled circles show the track for a continuous star formation without quenching. The red solid line linking the black edge triangles shows the track for tQ = 9 Gyr and τ = 0.5 Gyr.
Current usage metrics show cumulative count of Article Views (full-text article views including HTML views, PDF and ePub downloads, according to the available data) and Abstracts Views on Vision4Press platform.
Data correspond to usage on the plateform after 2015. The current usage metrics is available 48-96 hours after online publication and is updated daily on week days.
Initial download of the metrics may take a while.