Fig. 18
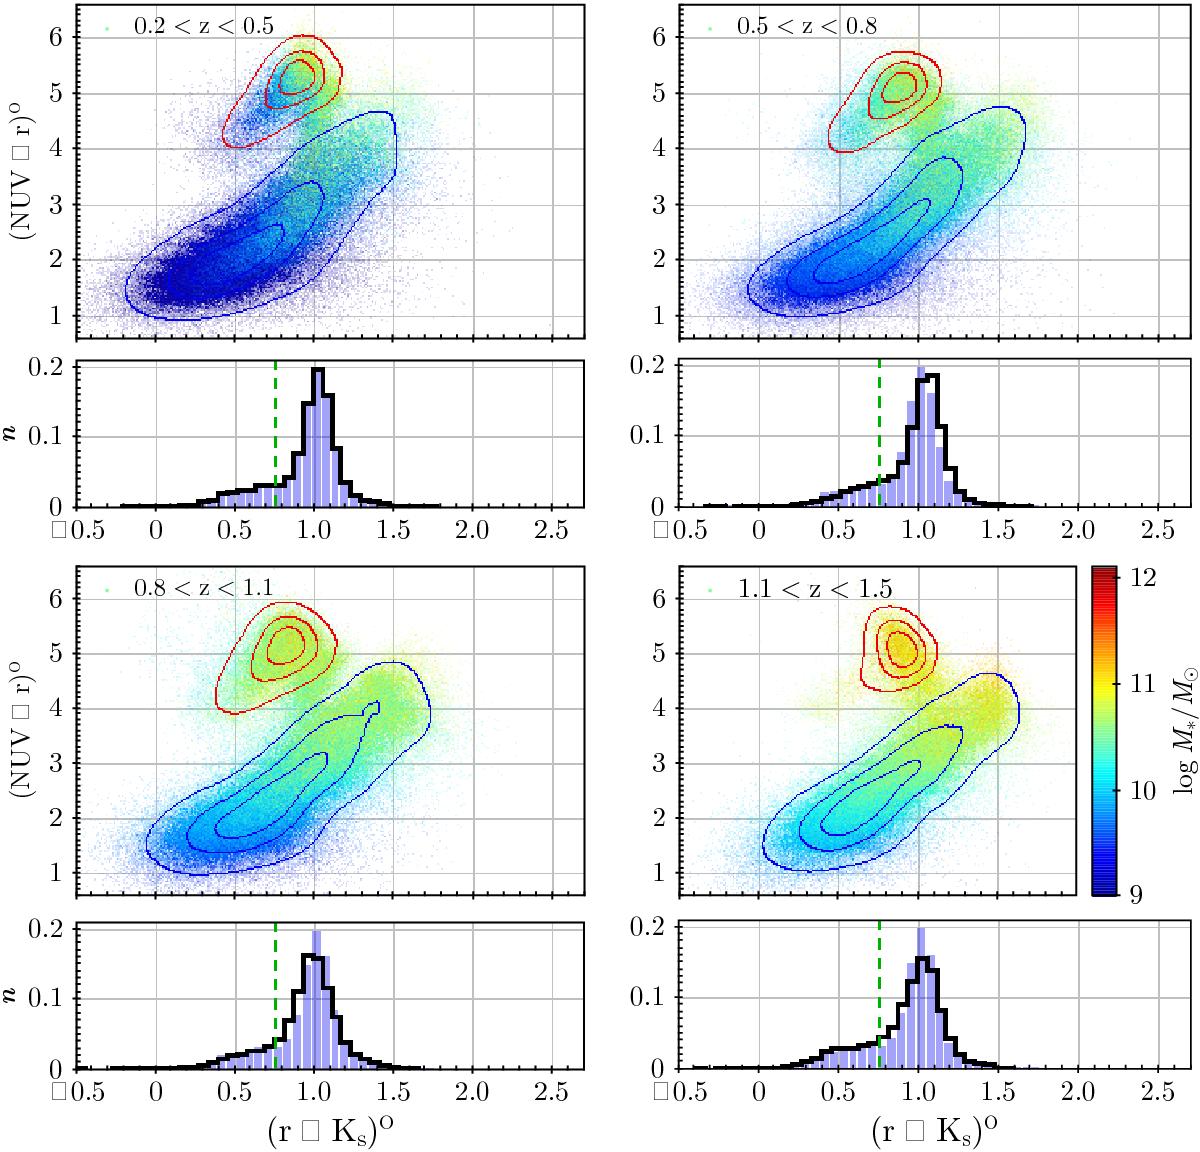
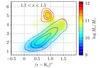
NUVrK galaxy distribution ouside and inside the green valley, shown in four redshift bins. Top sub-panels: NUVrK diagram as a function of the galaxy stellar mass. The red and blue contours show the equal density of the quiescent and star-forming populations, respectively, after excluding the transitioning galaxies (i.e. the galaxies lying in the green valley defined in Fig. 8). Bottom sub-panels: normalised number counts along the (r−Ks)° colour in the green valley (black solid line). The distribution at 0.2 <z< 0.5 is repeated in each panel for comparison (blue shaded area). The vertical green dashed line shows the limit of the ![]() -quenching channel, as discussed in Sect. 7.2.1.
-quenching channel, as discussed in Sect. 7.2.1.
Current usage metrics show cumulative count of Article Views (full-text article views including HTML views, PDF and ePub downloads, according to the available data) and Abstracts Views on Vision4Press platform.
Data correspond to usage on the plateform after 2015. The current usage metrics is available 48-96 hours after online publication and is updated daily on week days.
Initial download of the metrics may take a while.