Fig. 15
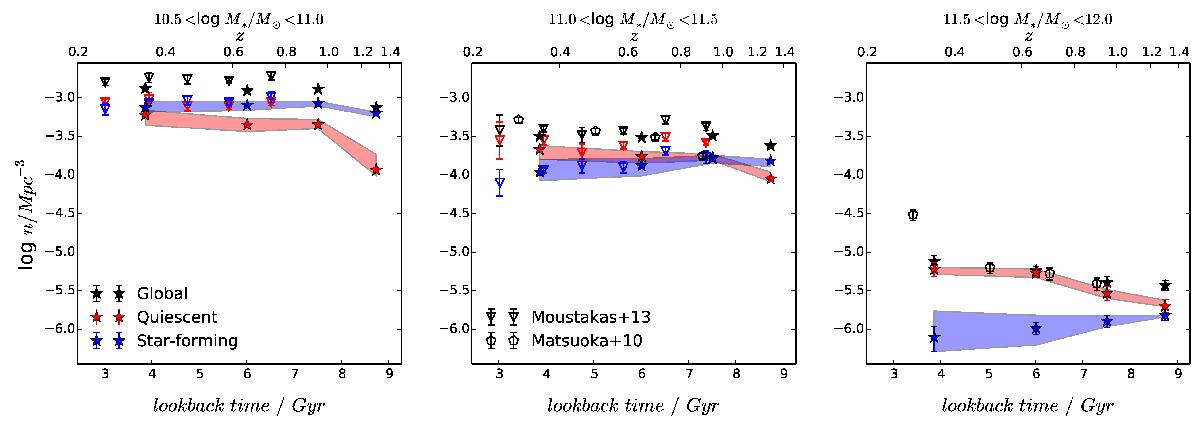
Evolution of the number densities in three bins of M∗, for the global (black), SF (blue), and Q (red) populations. The corresponding shaded area shows the systematic uncertainty that is due to the SF/Q selection around our reference measurement (stars). The measurements of Moustakas et al. (2013, triangles) and Matsuoka & Kawara (2010, pentagons) are plotted for comparison.
Current usage metrics show cumulative count of Article Views (full-text article views including HTML views, PDF and ePub downloads, according to the available data) and Abstracts Views on Vision4Press platform.
Data correspond to usage on the plateform after 2015. The current usage metrics is available 48-96 hours after online publication and is updated daily on week days.
Initial download of the metrics may take a while.